Predefined Dashboard
To access the Predefined dashboard click on  on the main page.
ChoiCo Predefined Dashboard
The dashboard contains two tabs, ChoiCo Playmode Behavior and ChoiCo Designing Behavior.
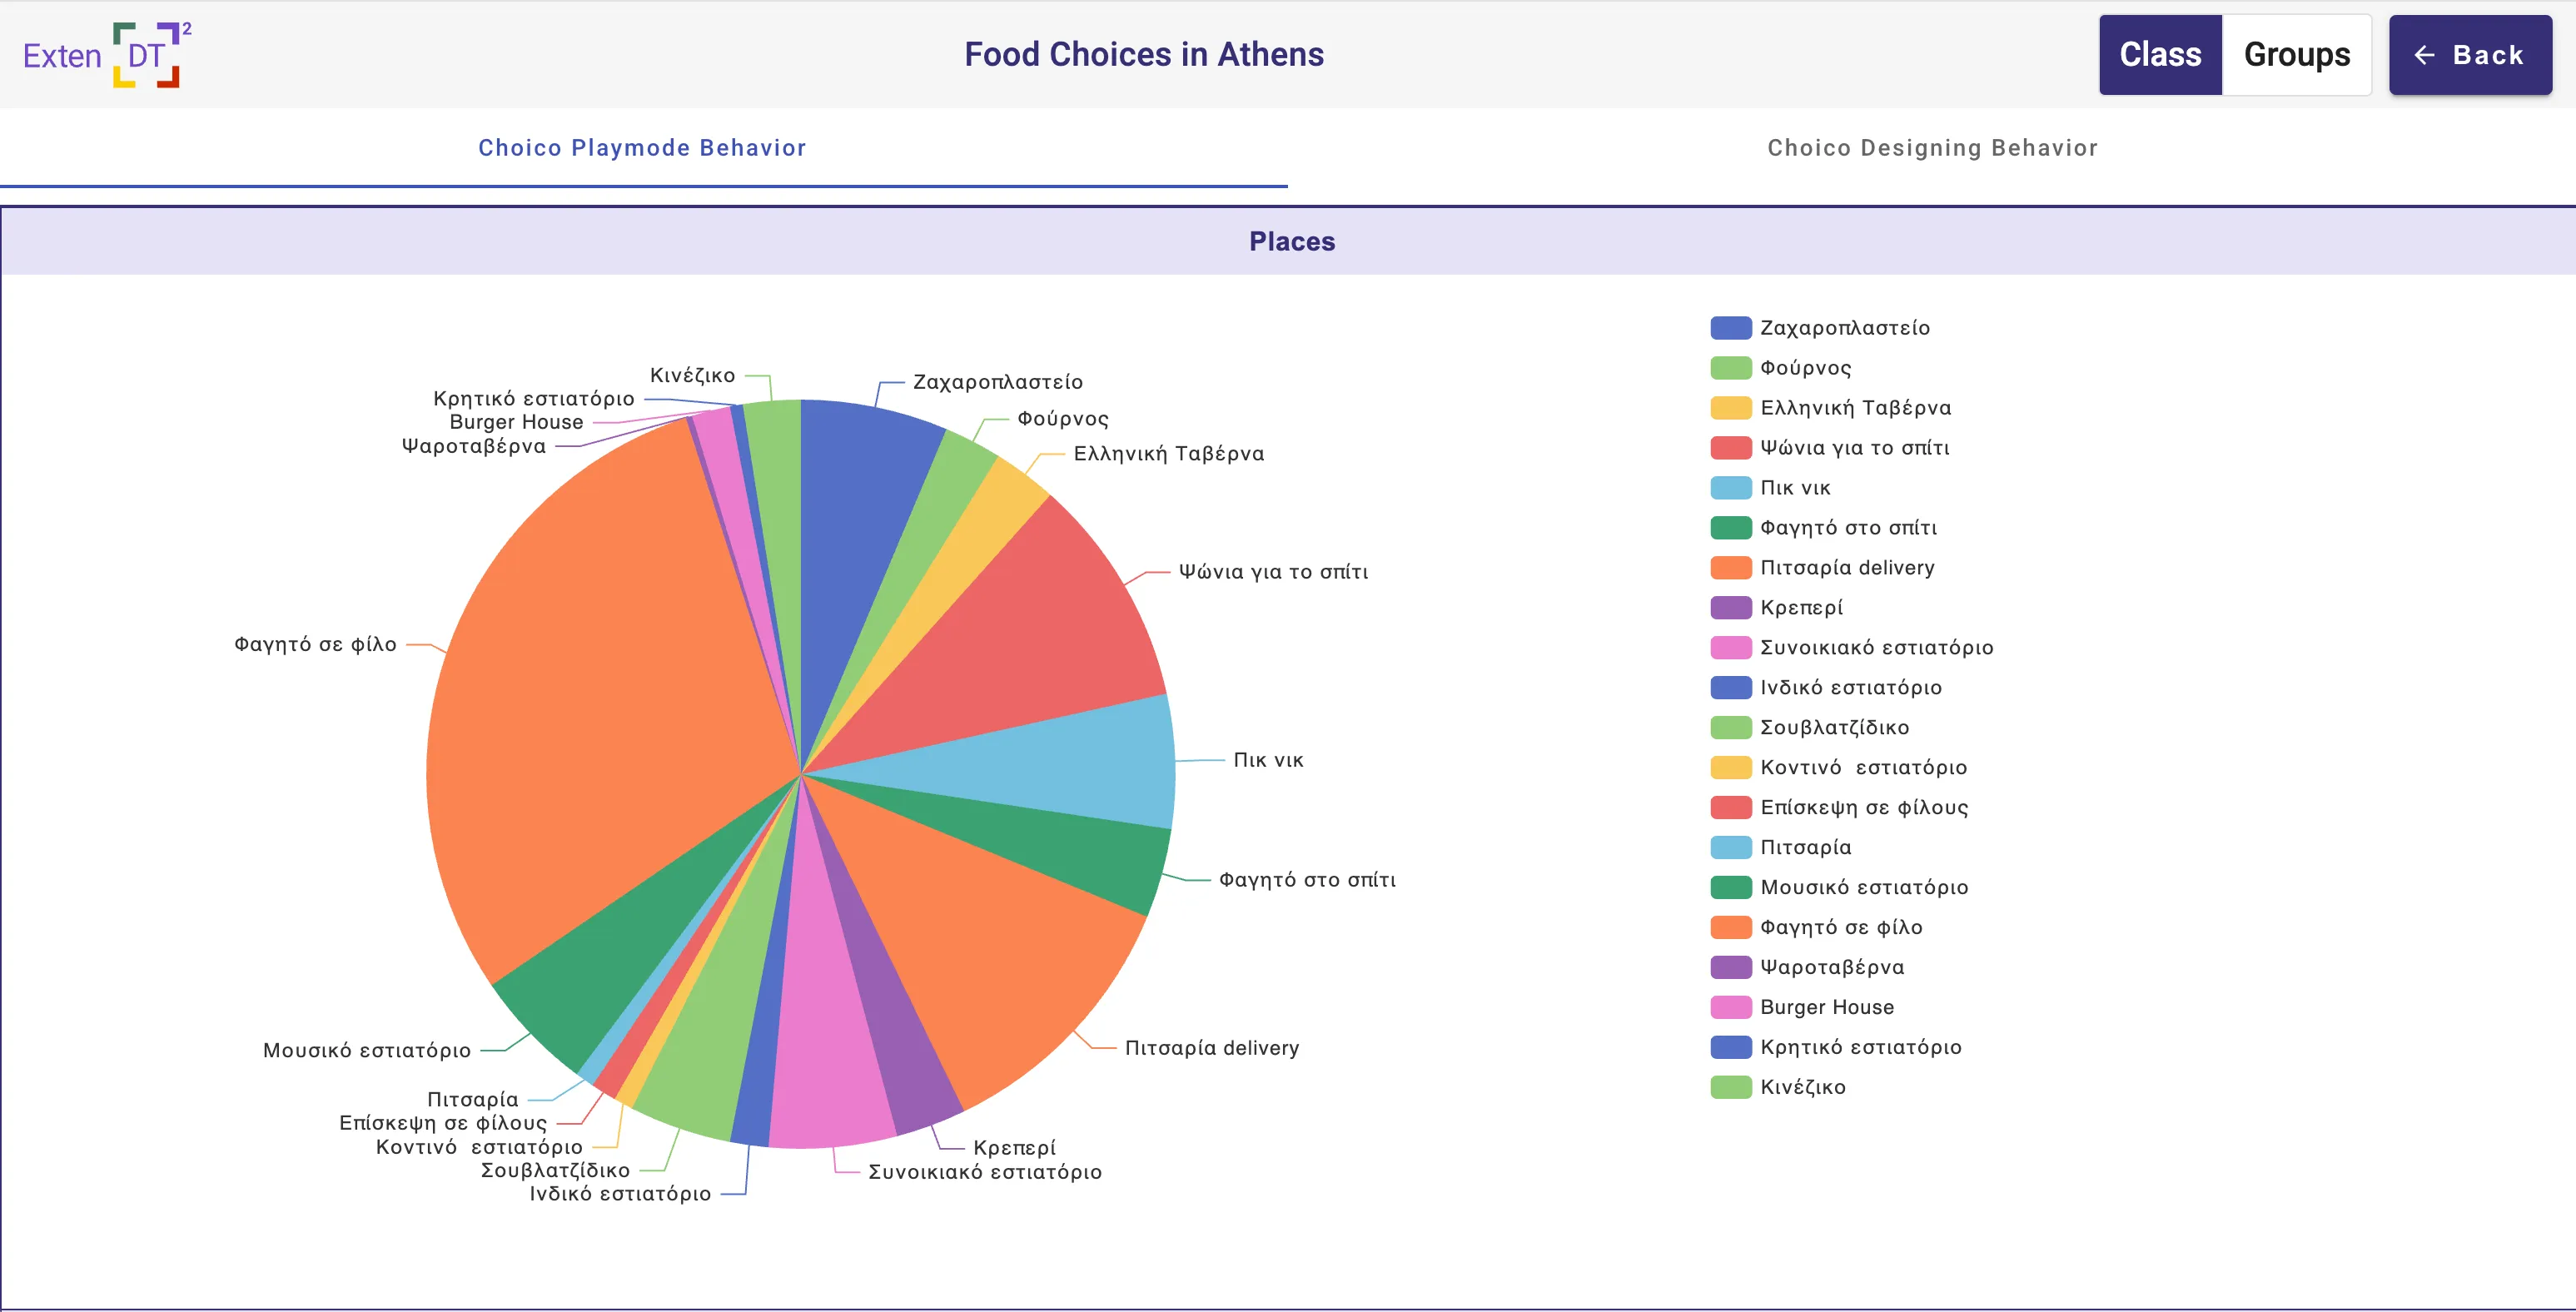
ChoiCo Playmode Behavior
This tab shows a summary about the created and most visited places in the games, the number of times learners played the game and the performance (as final game scores) after each game over event.
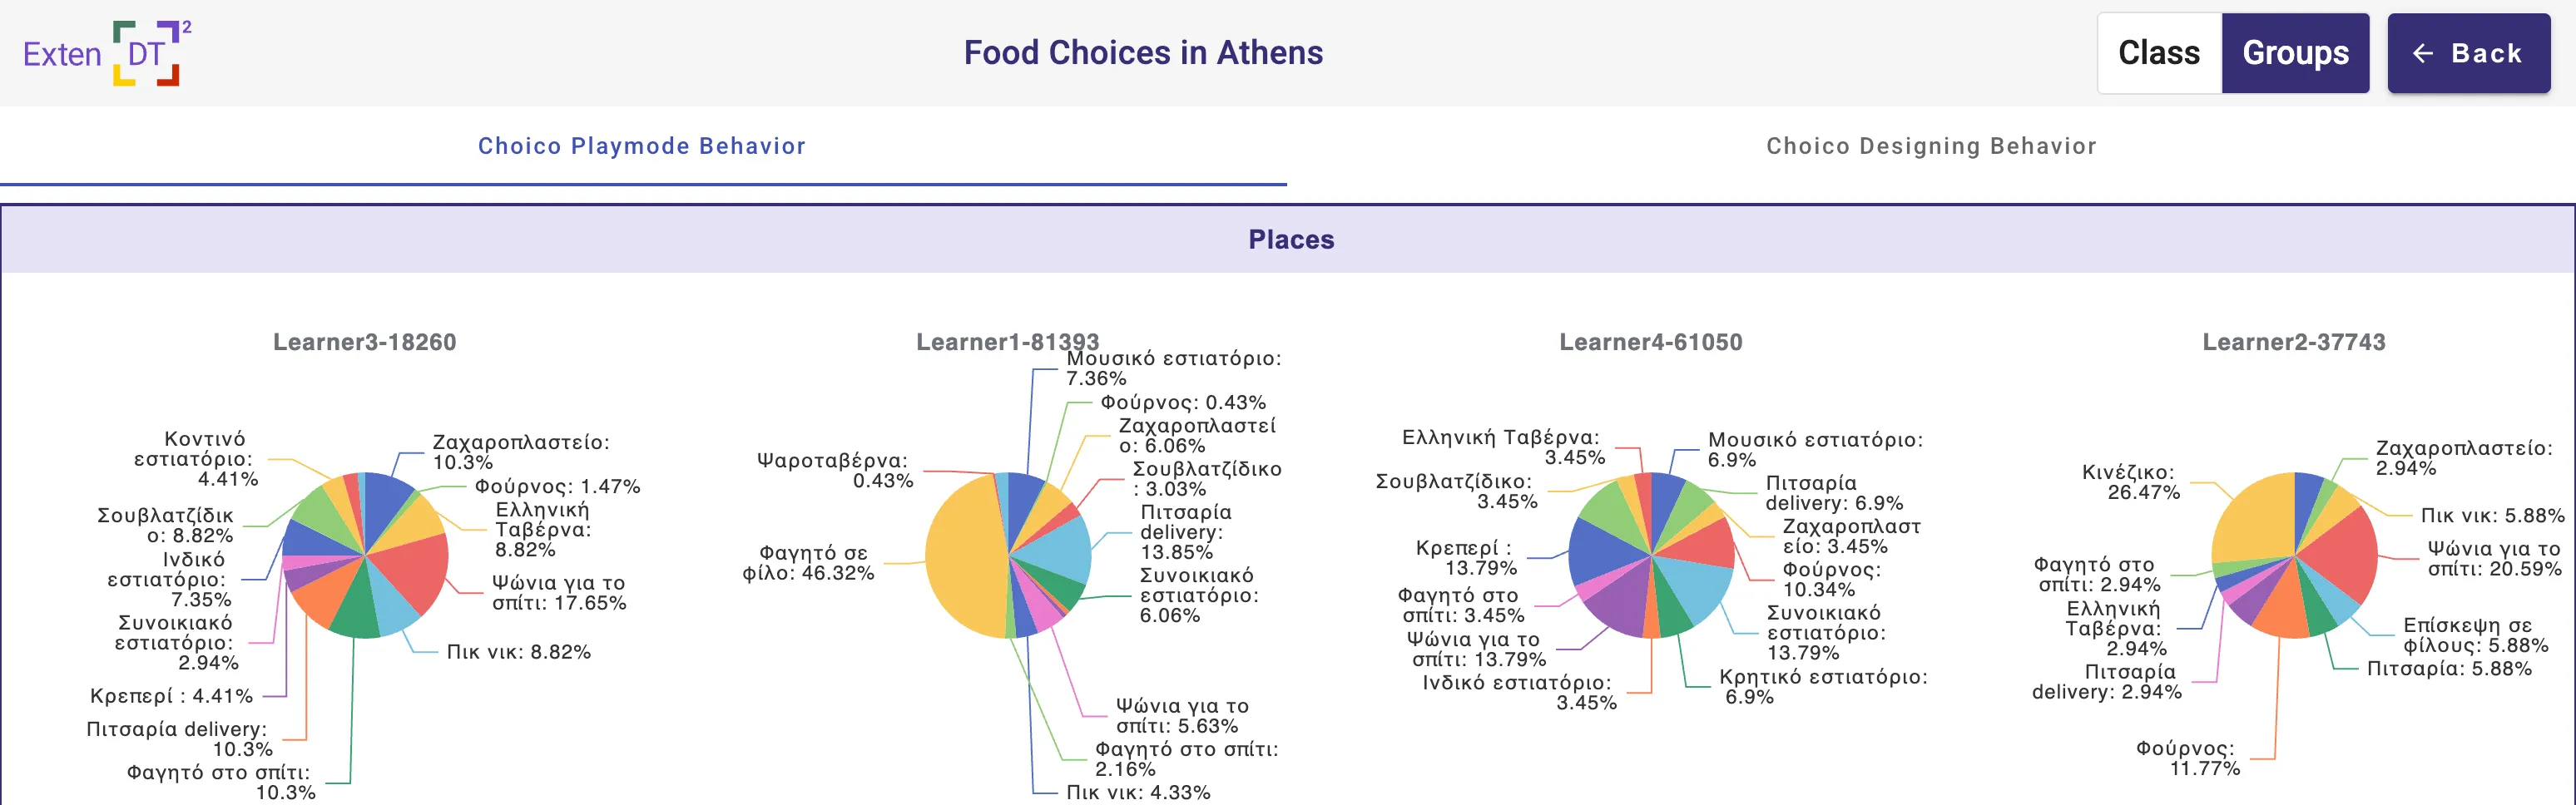
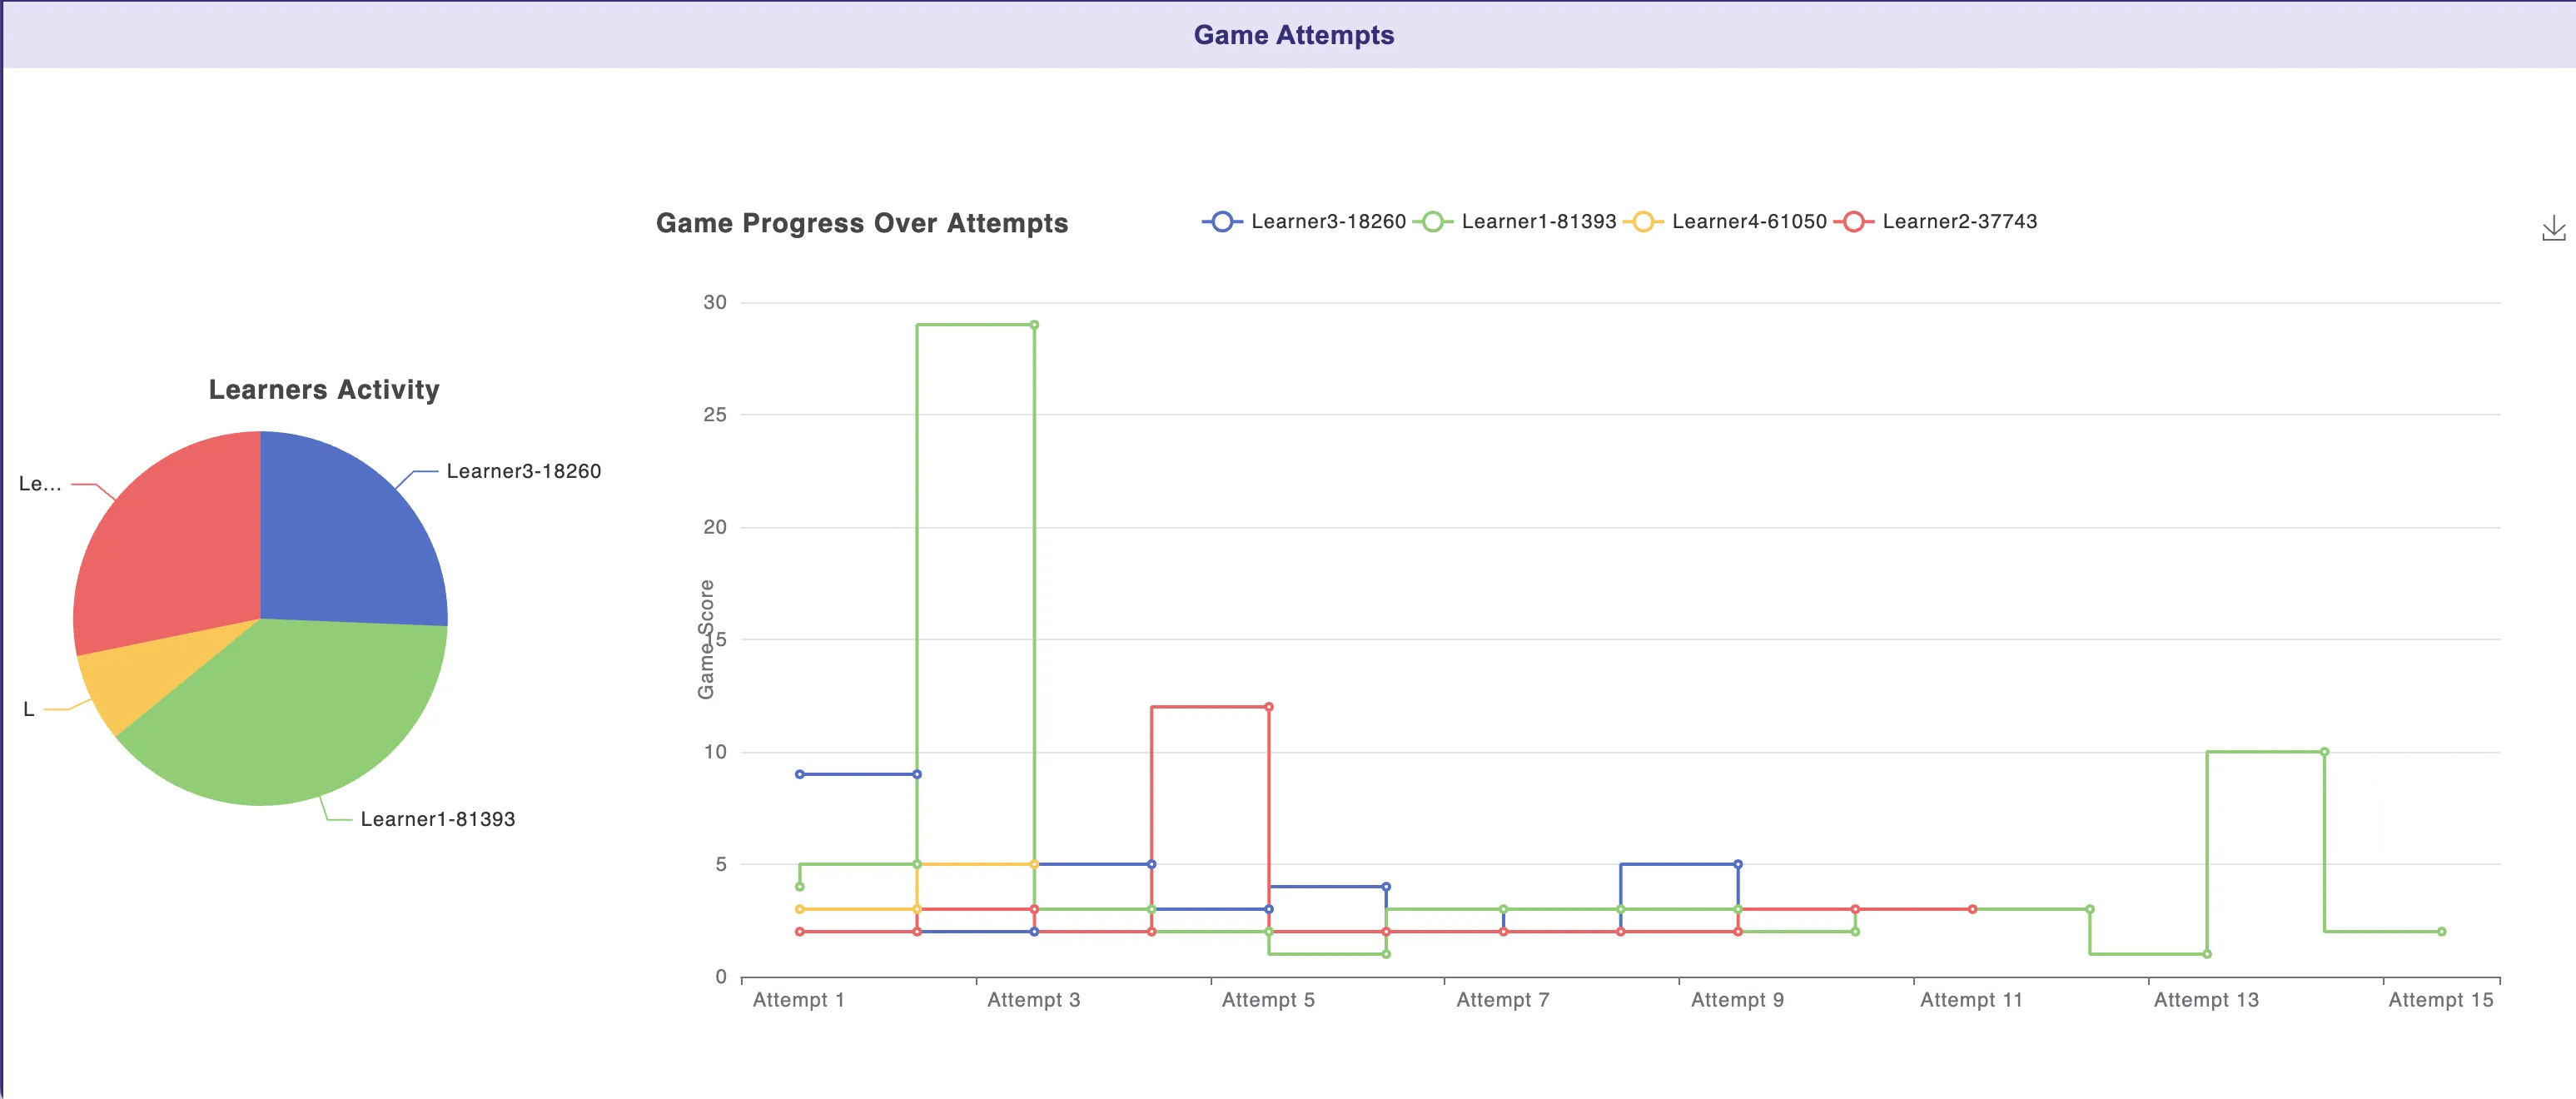
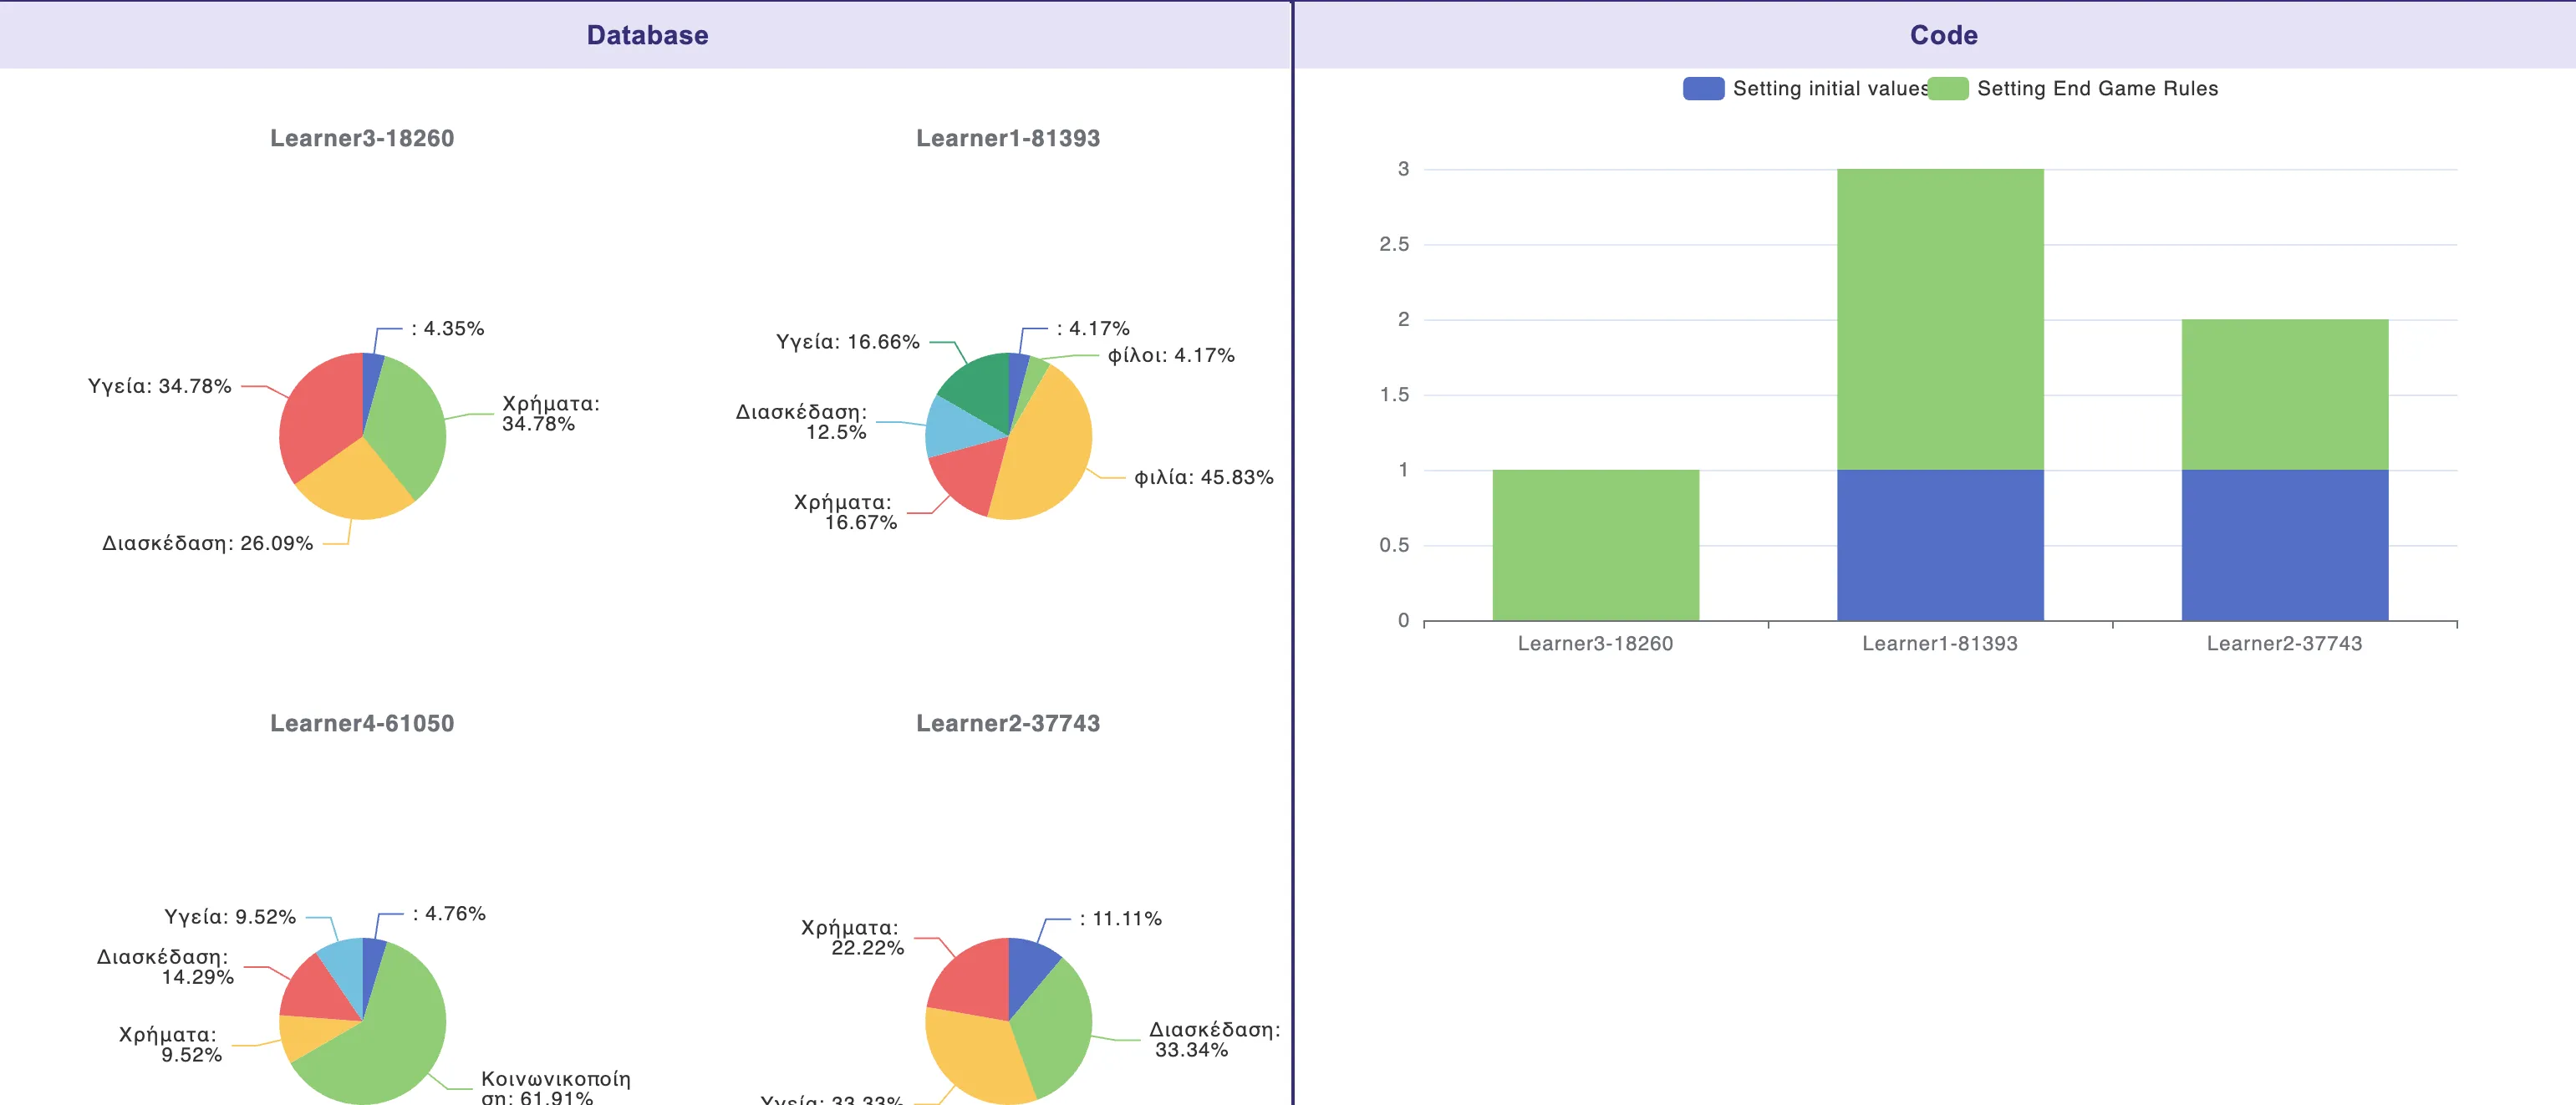
If you want to see on the individual level, then you need to switch to Groups mode in the upper right corner of the page.
The pie chart with all the places will then be generated for each individual learner (or group of learners) as shown in the image below.
The Game attempts section contains a pie chart on the left side, showing the number of times the learners played the games. On the right side, a step line chart is presented to visualize the progress of the game progress over attempts. It is also possible to filter out learners and see only individual learner by unselecting them in the chart legend.
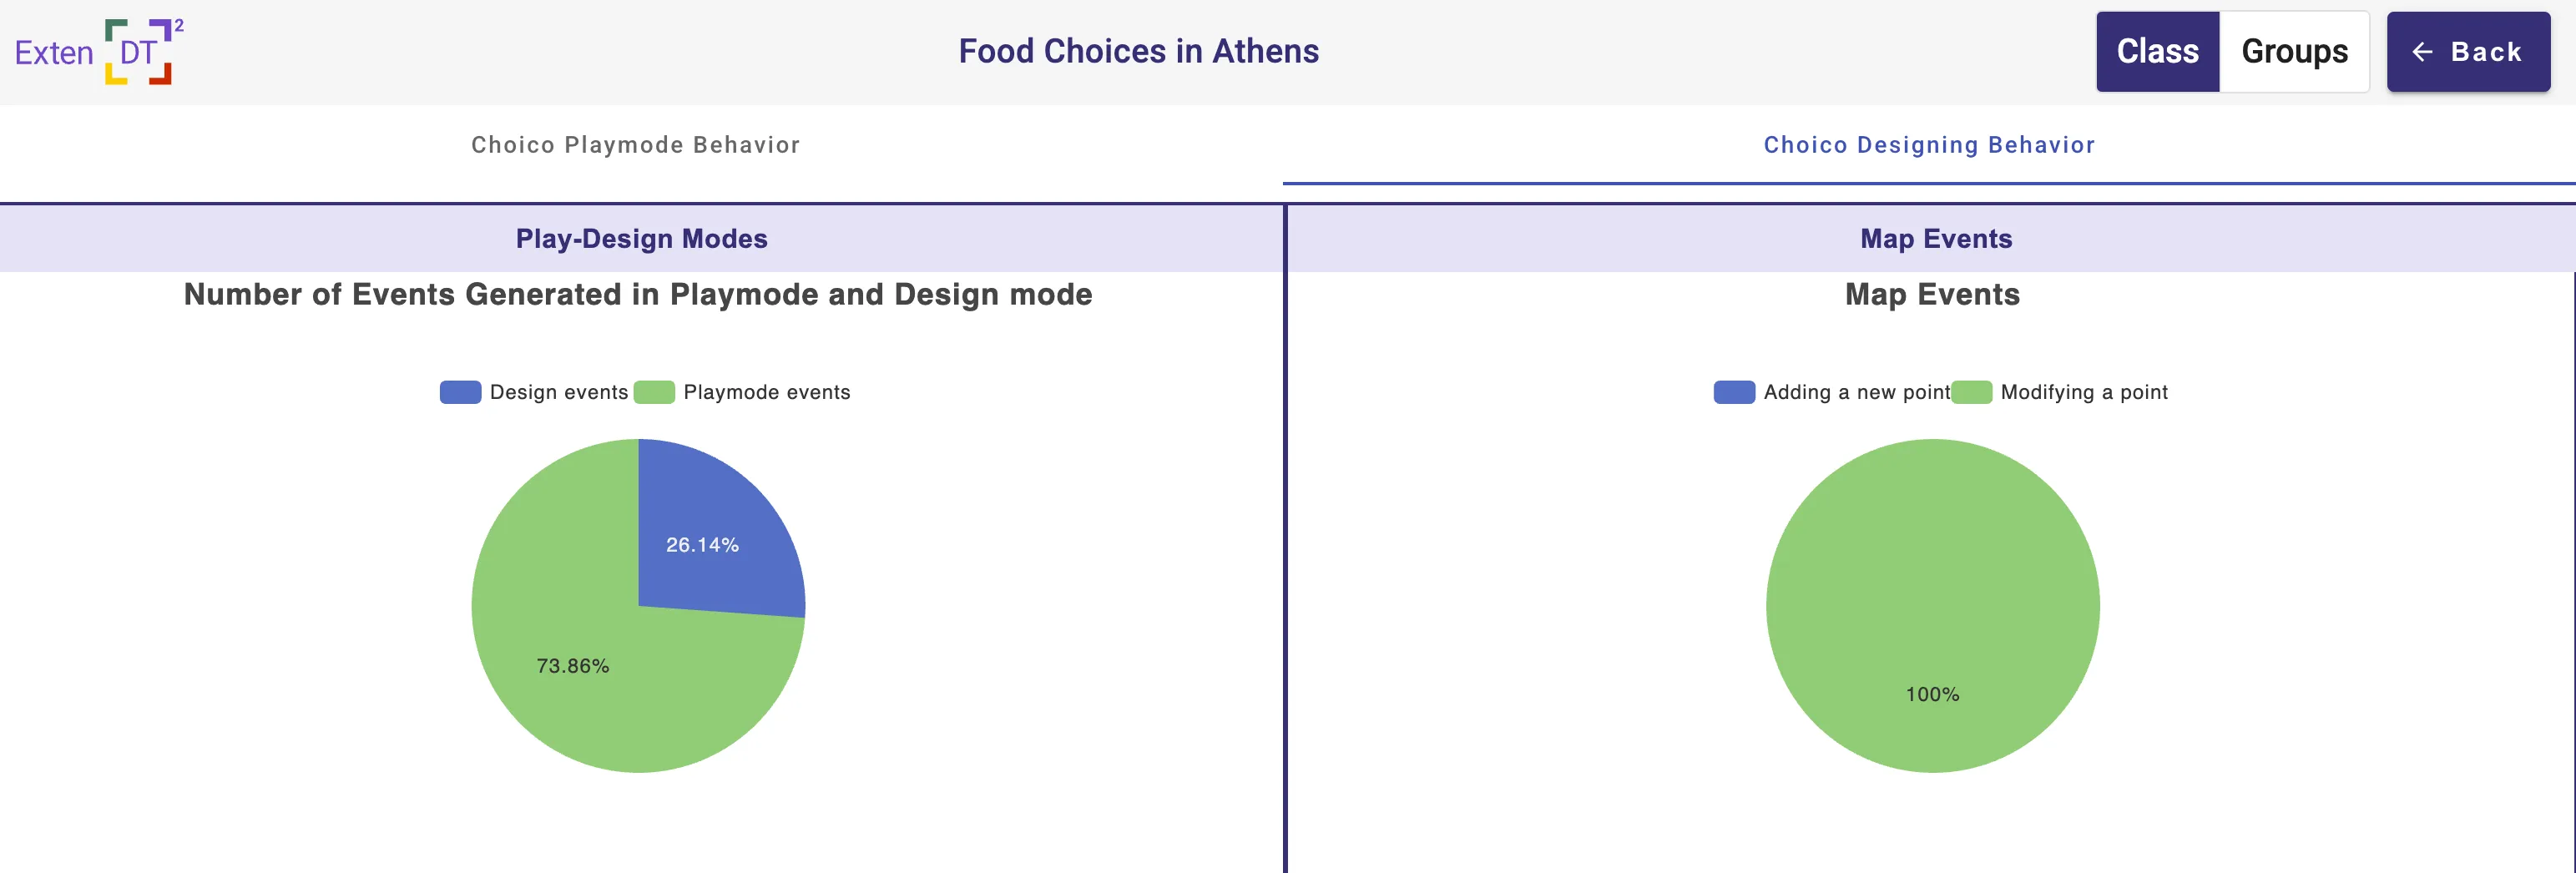
ChoiCo Designing Behavior
ChoiCo Designing Behavior provides a summary of the events generated in design and play modes, adding/modifying points in the map.
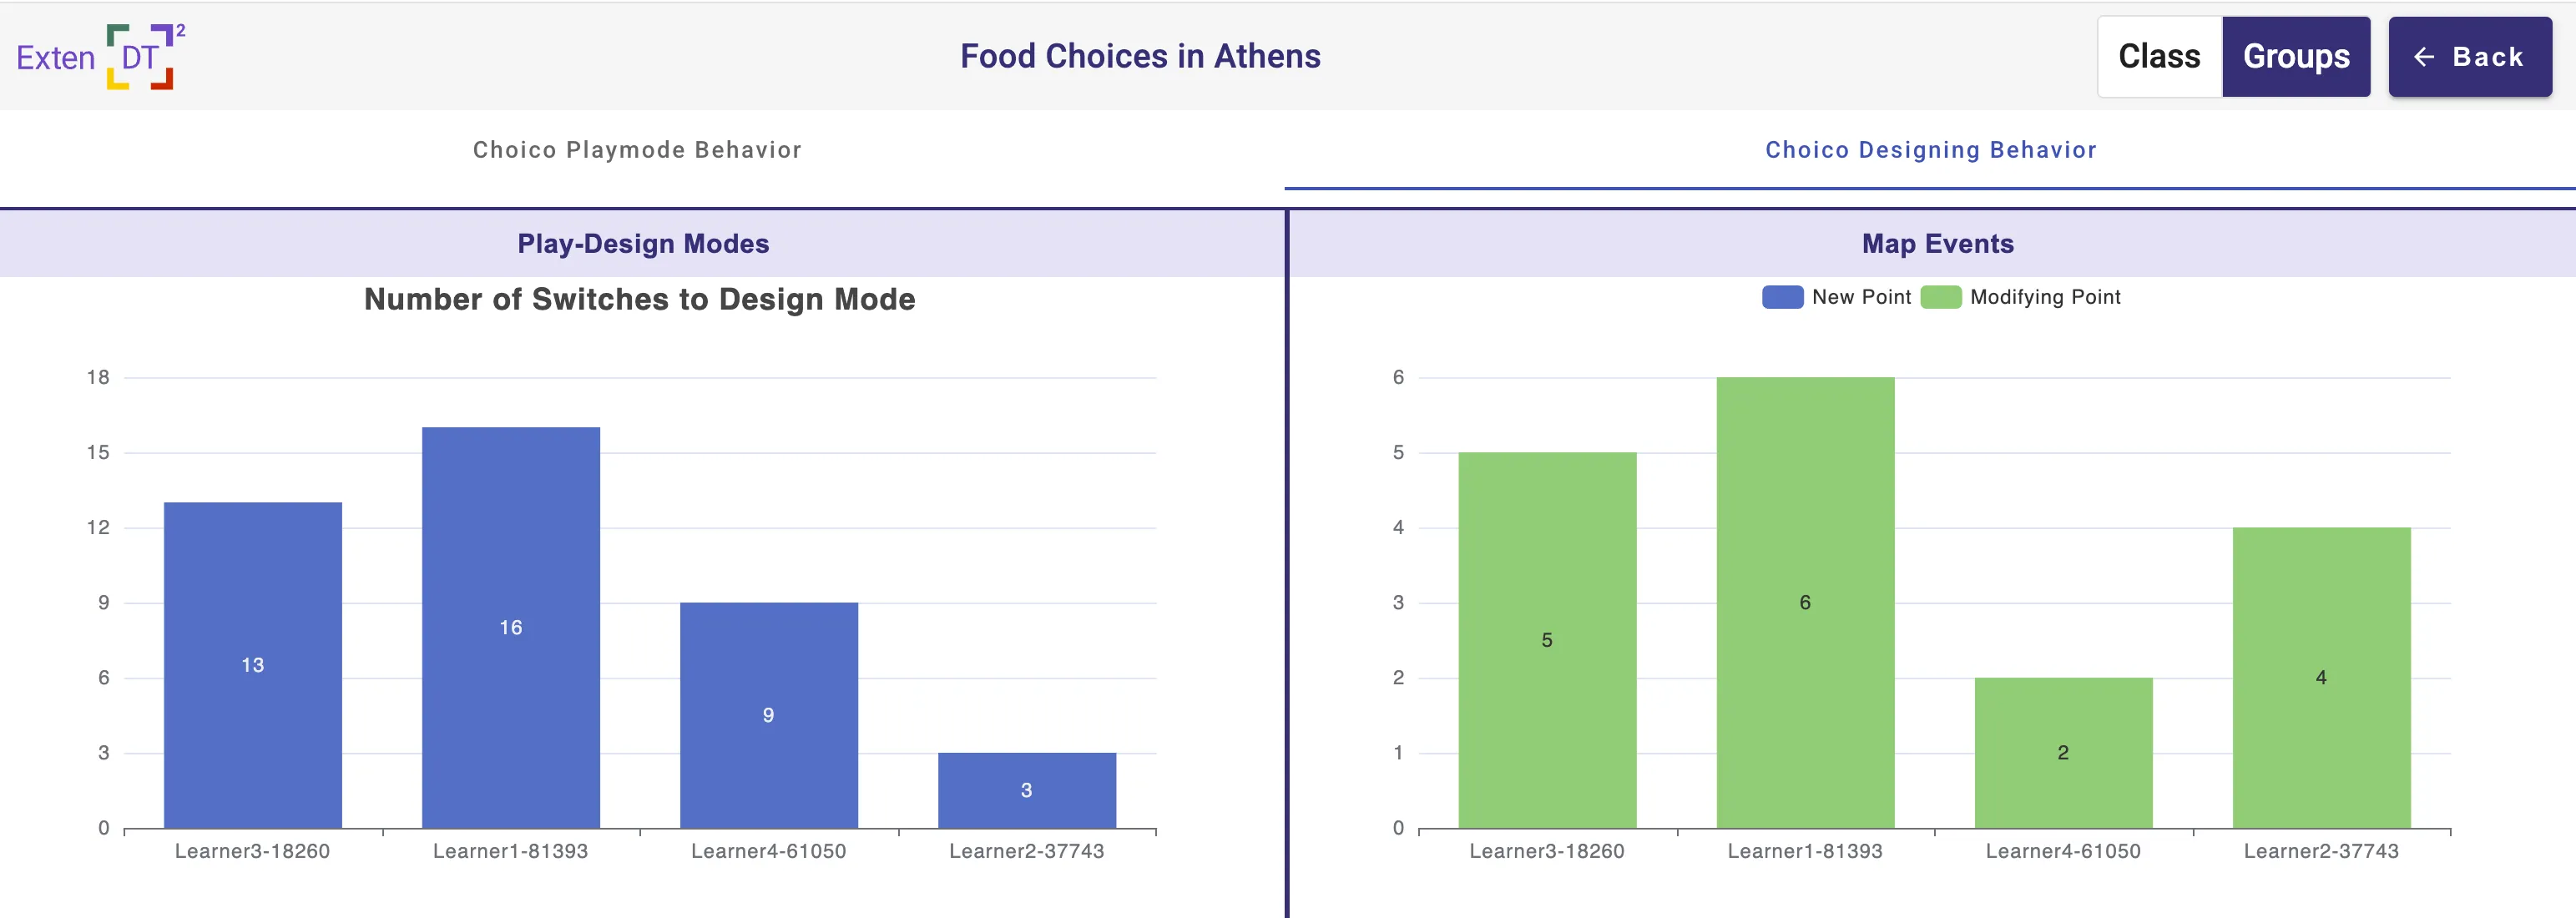
The same can be done for individual learners by switching to group mode.
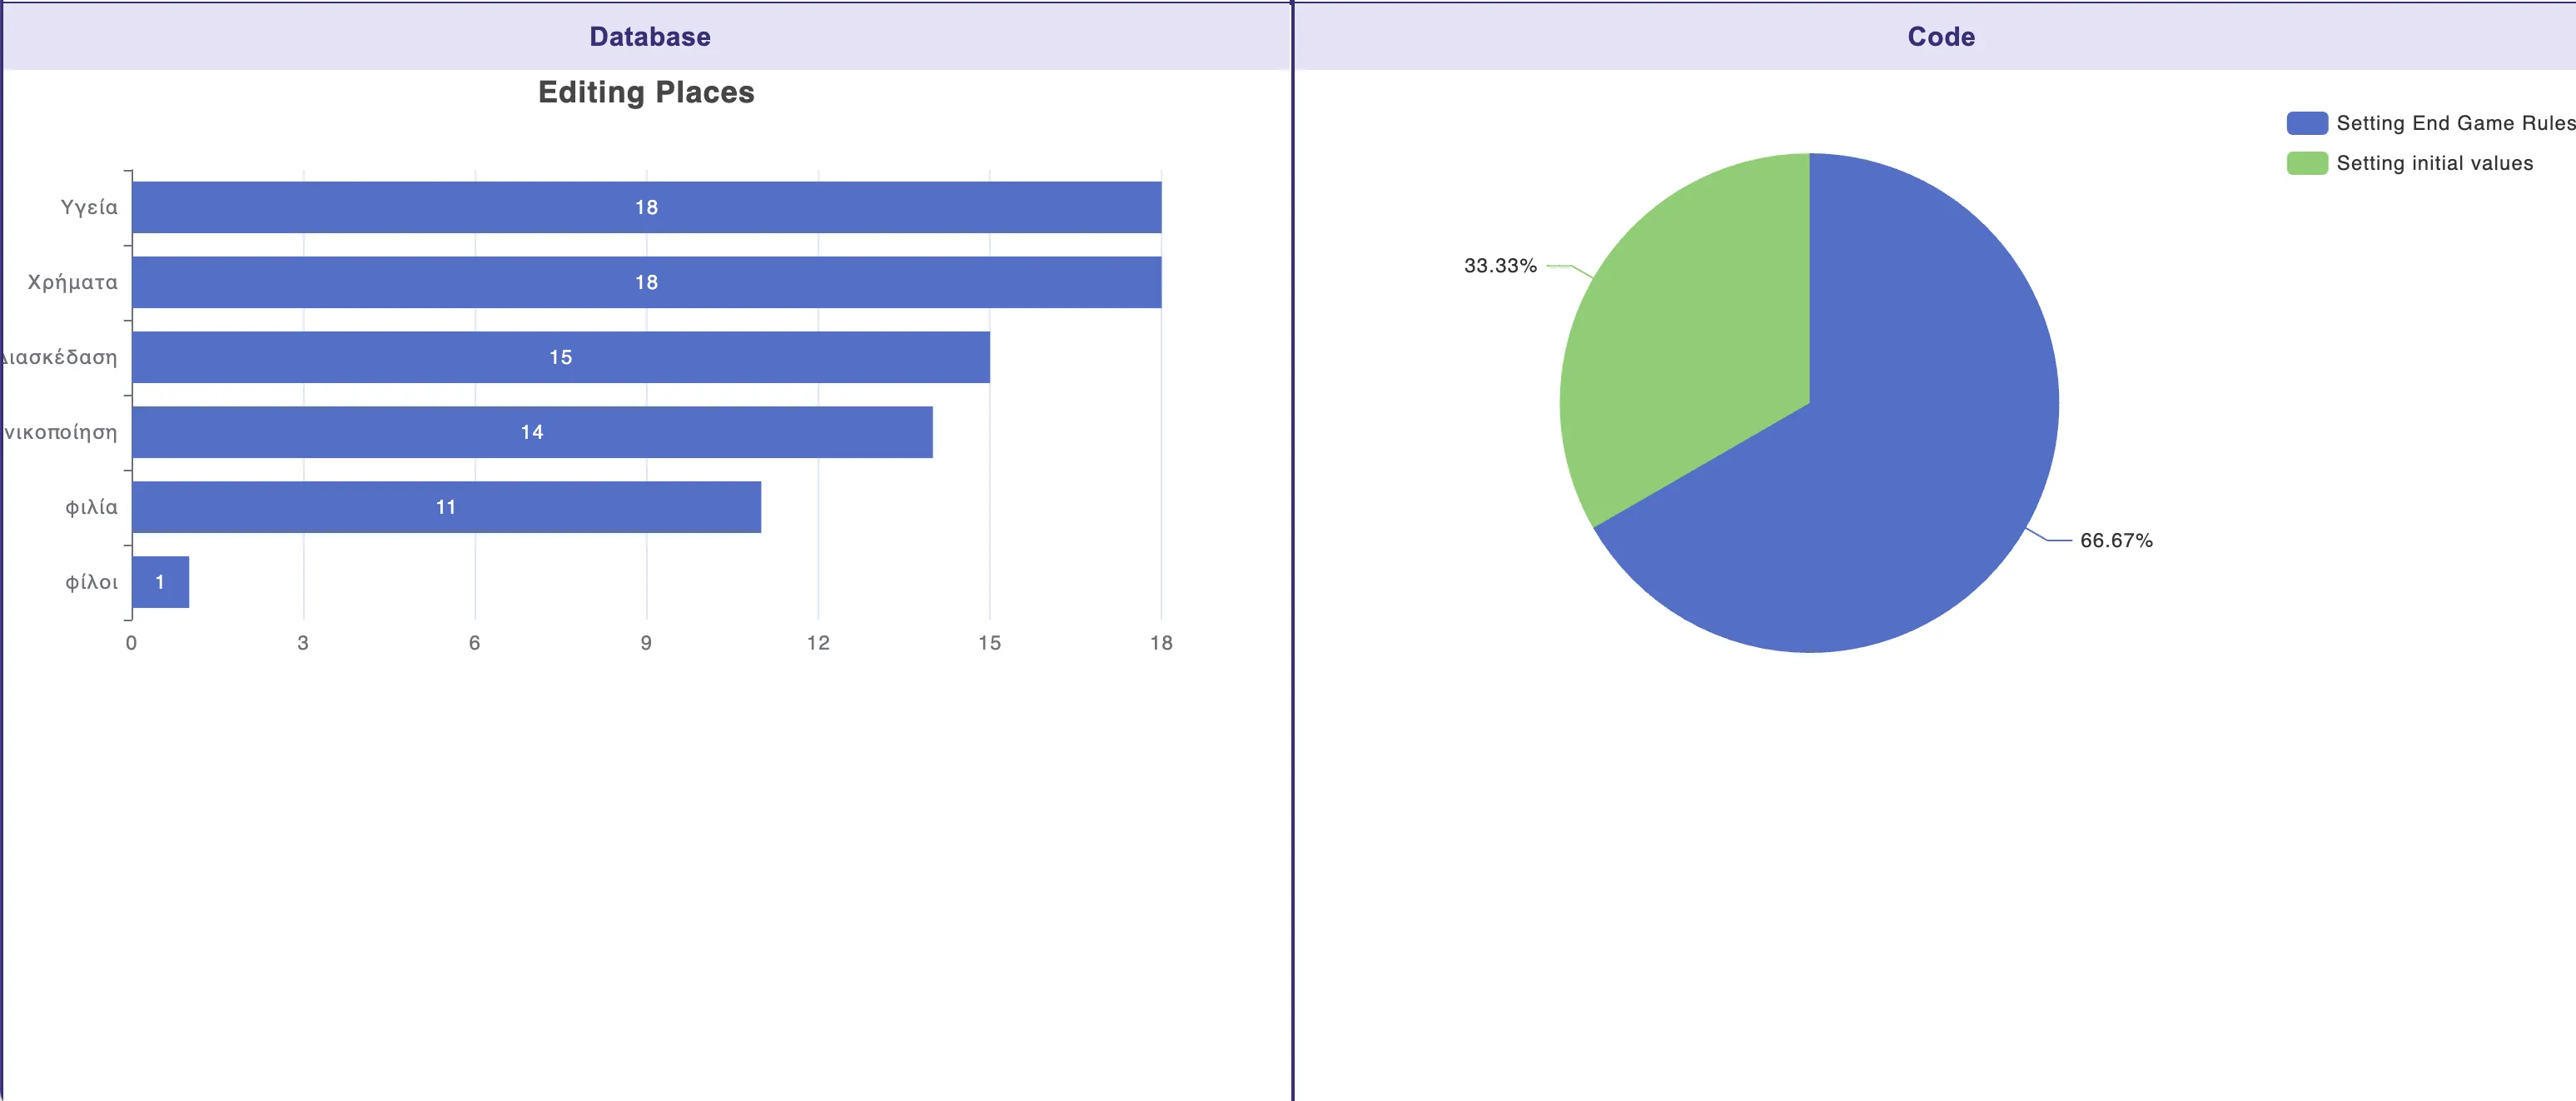
Additionally, it shows a bar chart (in class level) of the editing places to compare which places were the most modified (edited) by learners, and a pie chart for coding events such as writing initial values or/and game ending rules.
and the same but for individual learners:
Sorbet Predefined Dashboard
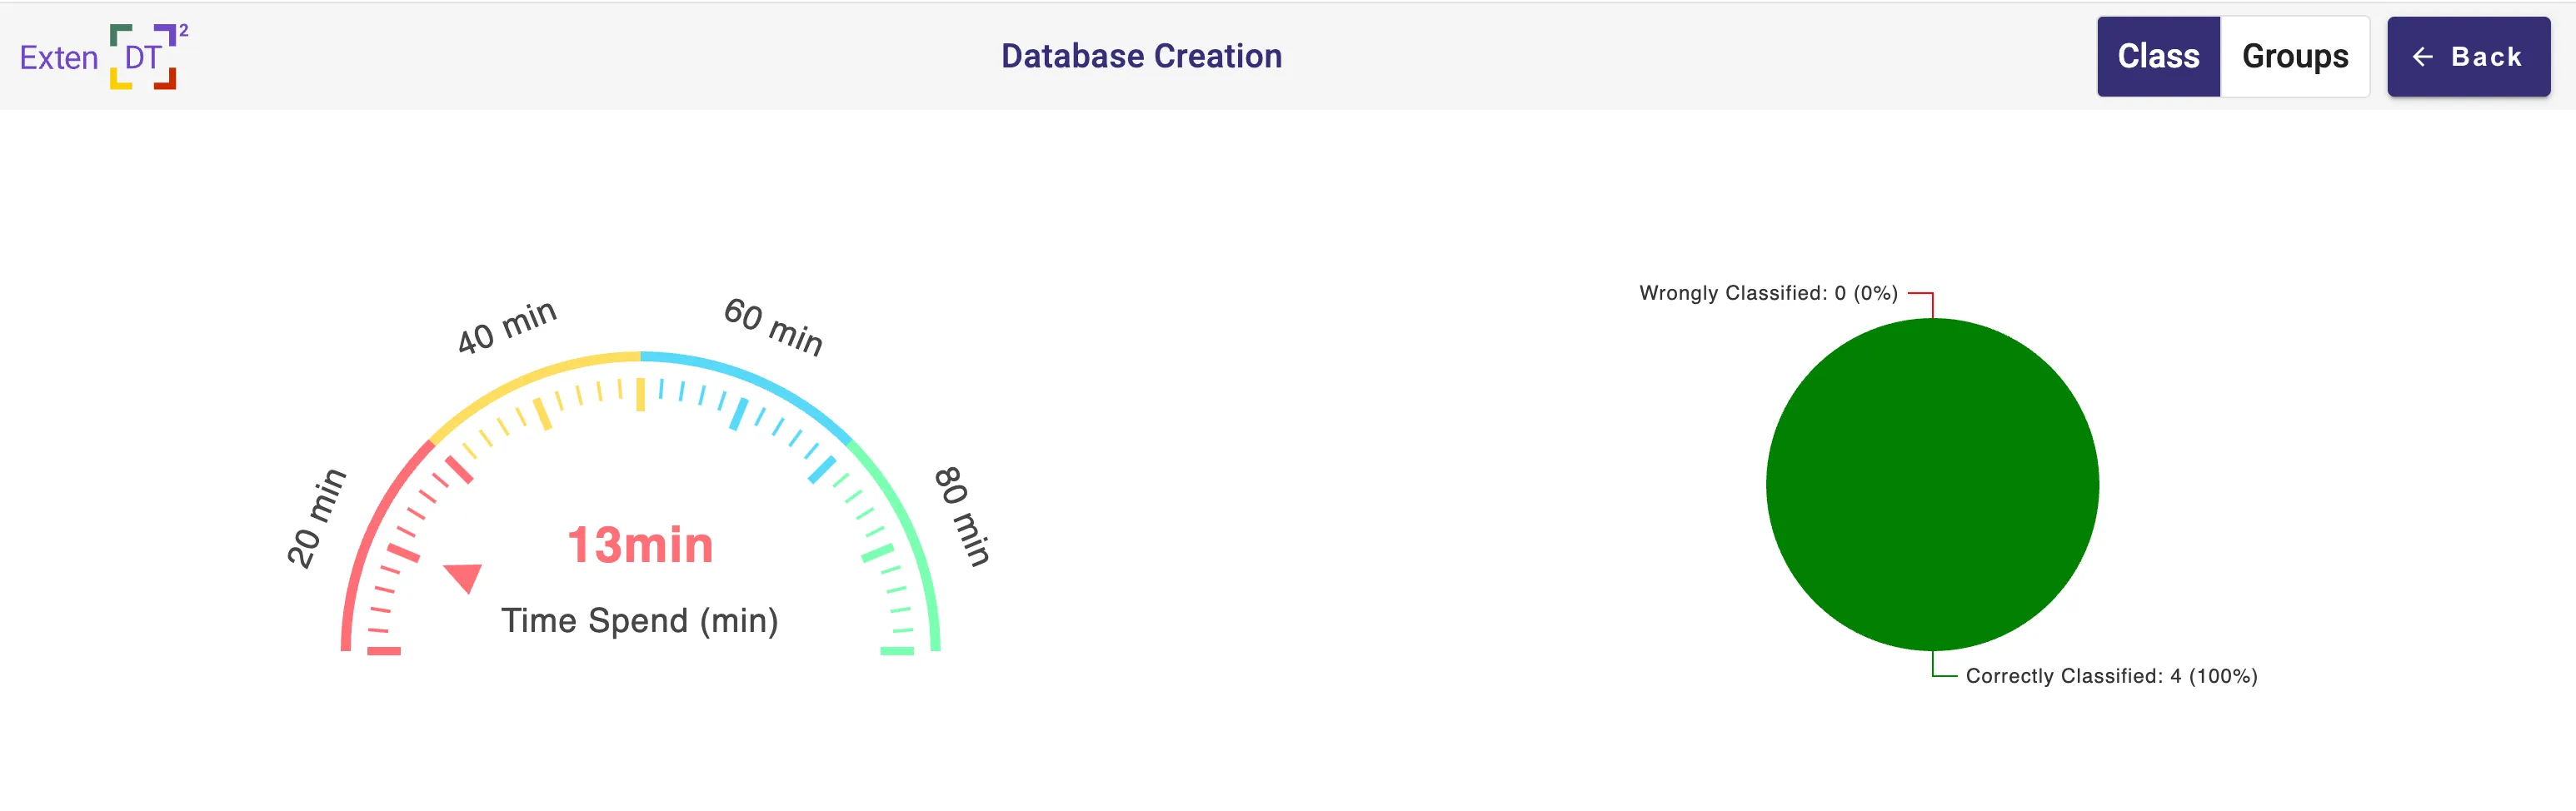
The dashboard shows on the left side the total time spend in minutes by all learners in the learning activity and the pie chart with total correctly classified and wrongly classified objects.
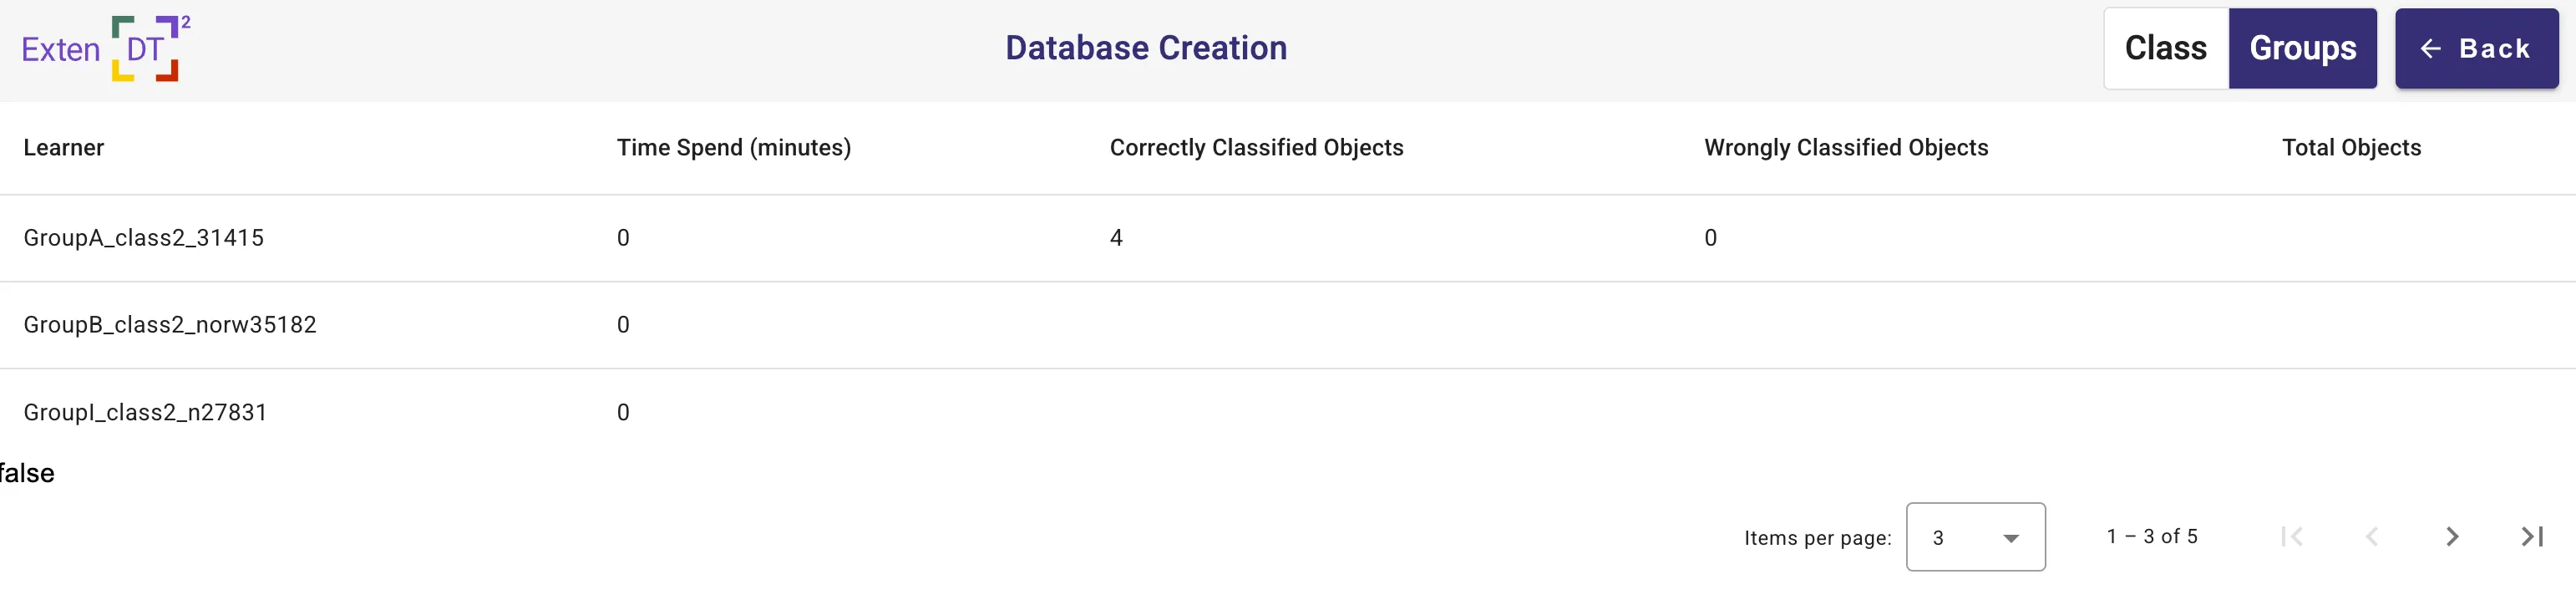
and for individual mode, it shows the table with learner id, total time in minutes spend in the learning activity, total of correctly classified objects, total wrongly classified objects, and total objects created in the games. If the values are empty in the tables, it means no events were generated for this learner.
Malt2 Predefined Dashboard
The dashboard contains three tabs, Code History, Slider Interactions, and Camera Interactions.
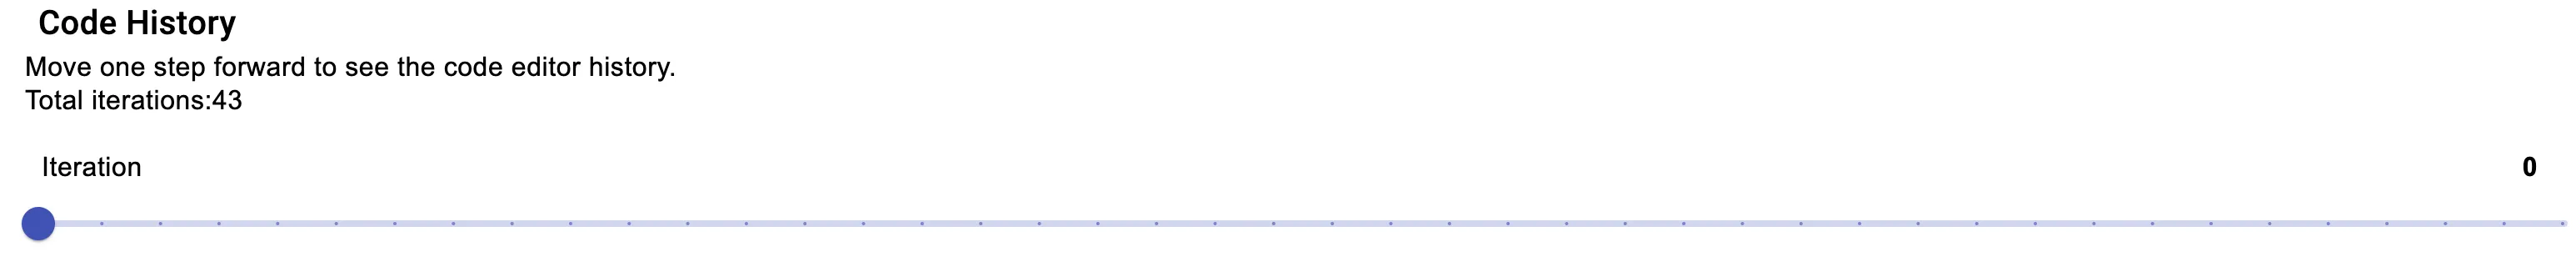
Code History
In Code History you need to switch to the Groups mode (individual mode) and then select the learner from the drop down list. Then the dashboard will show the lines of code at the beginning of the learning activity.
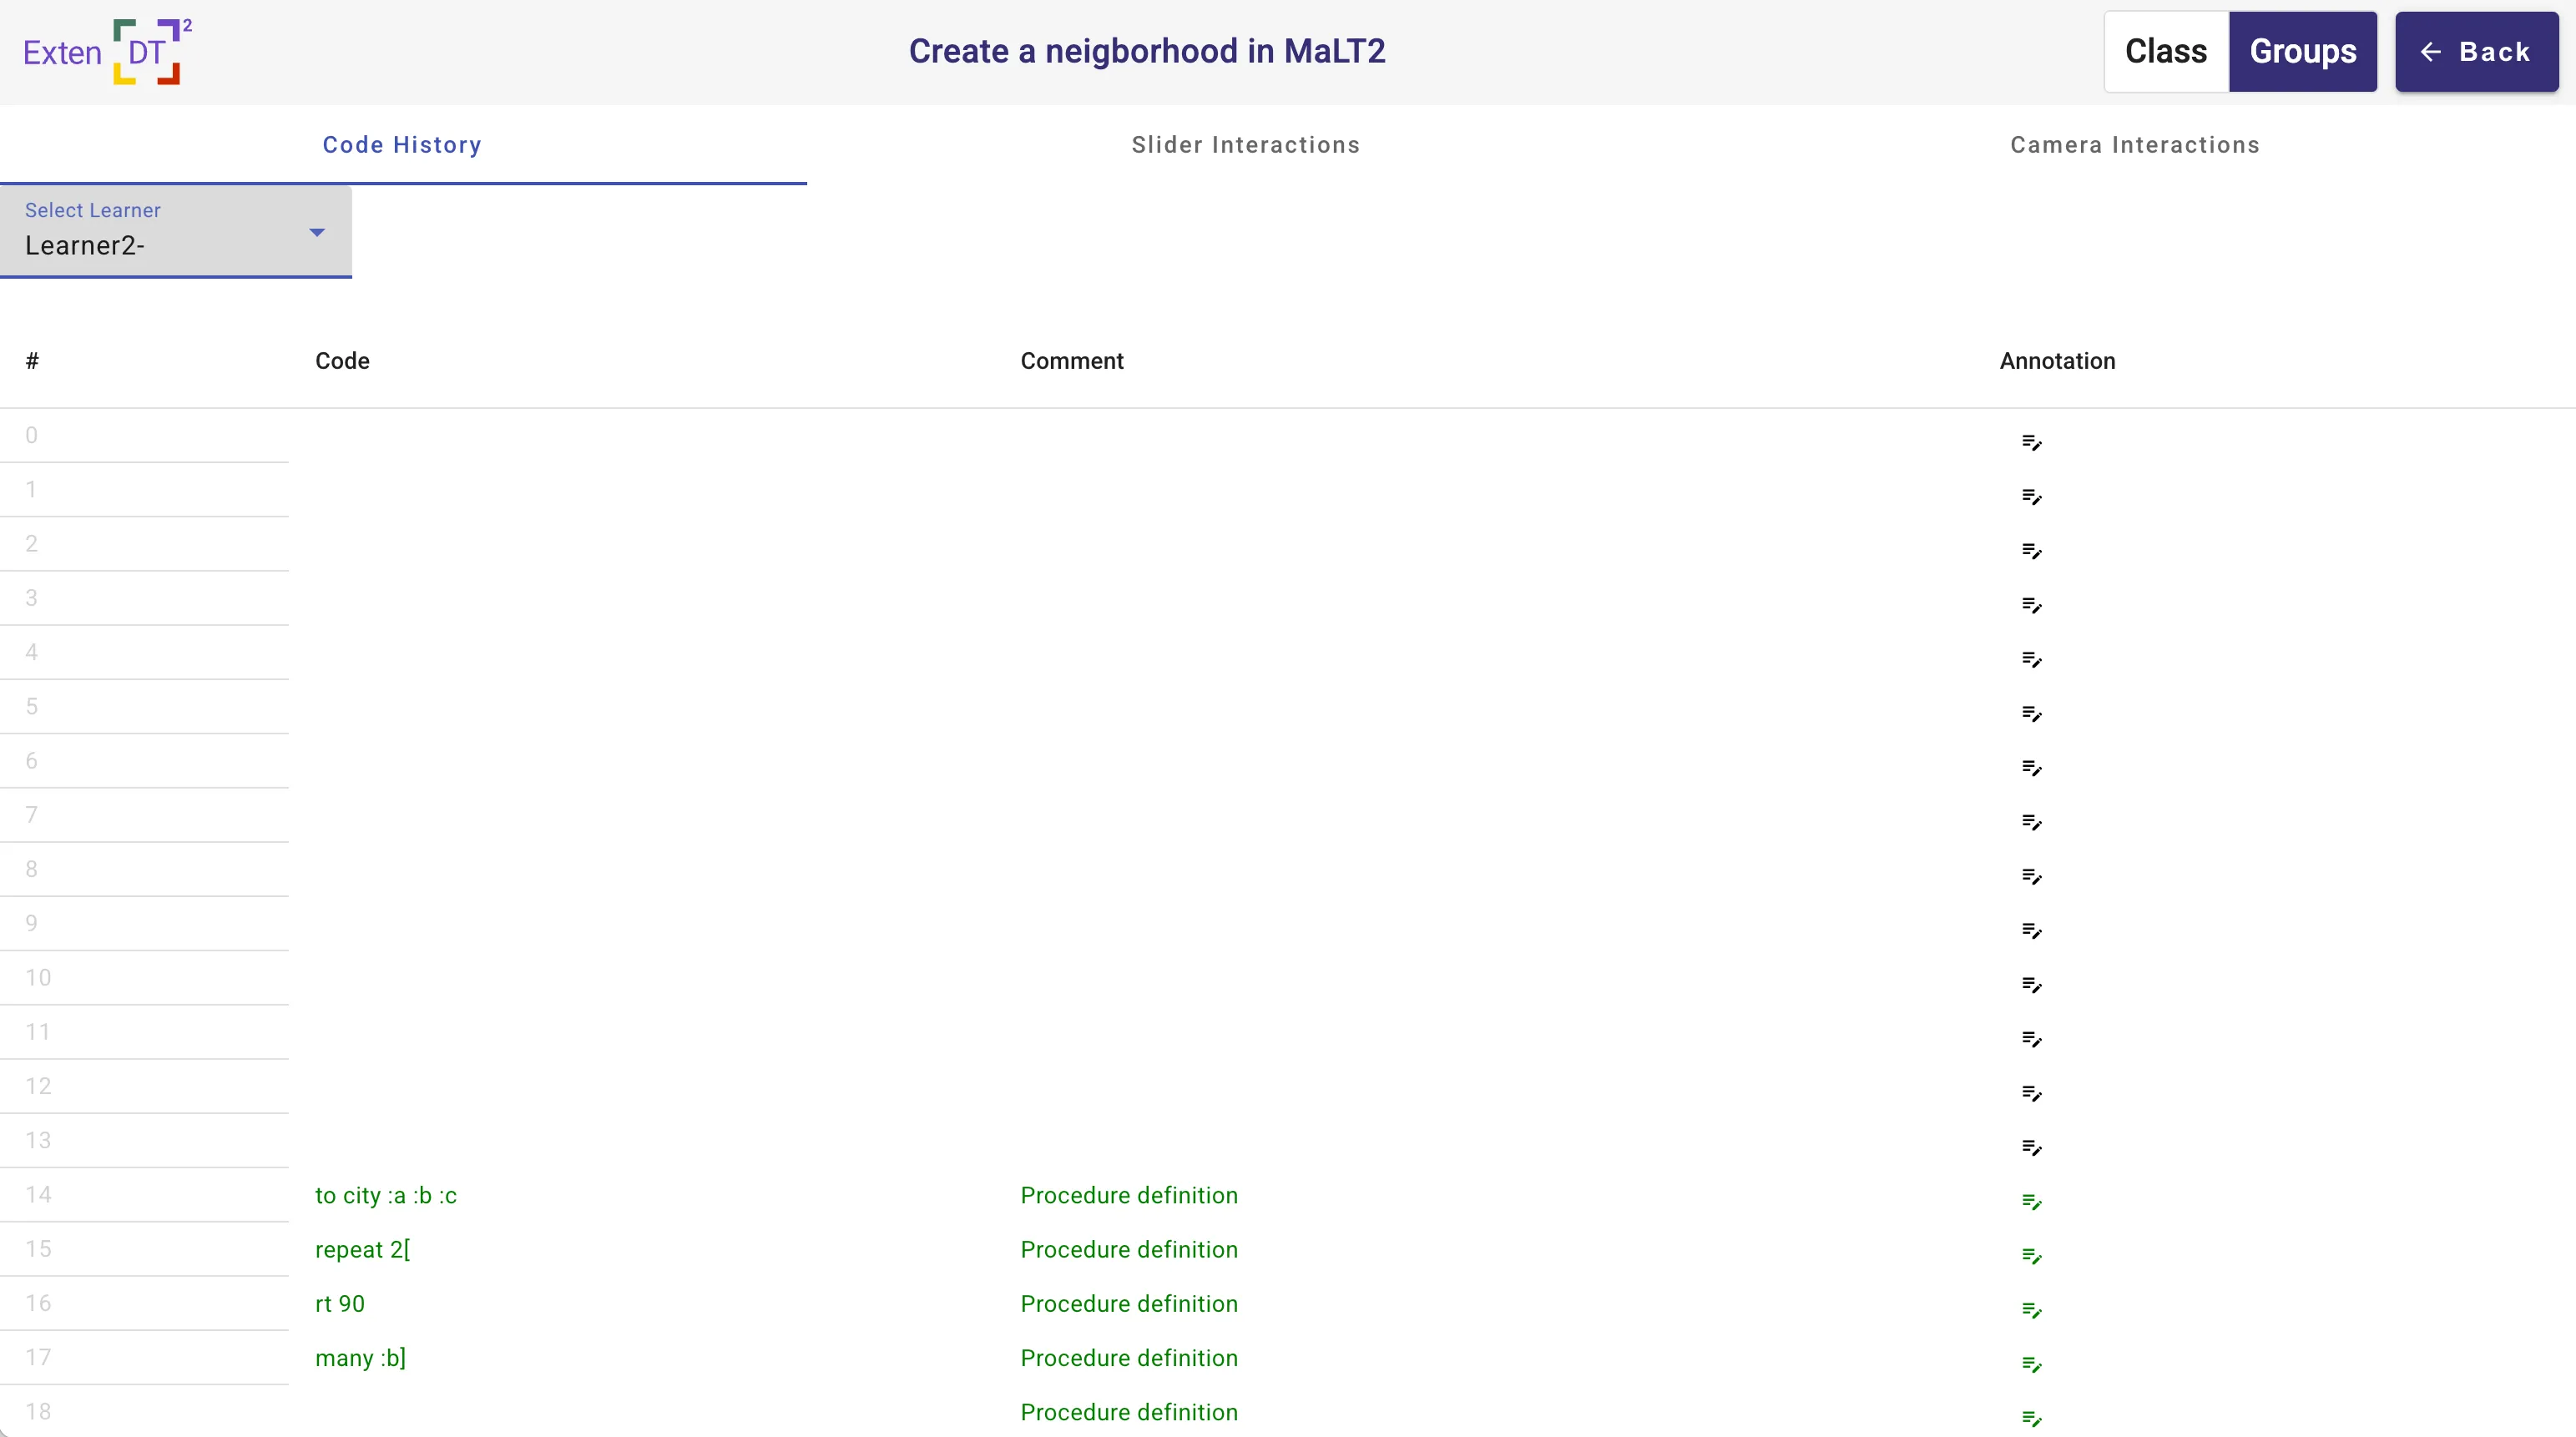
It is possible to scroll for each iteration/change in the code and see how the code was modified
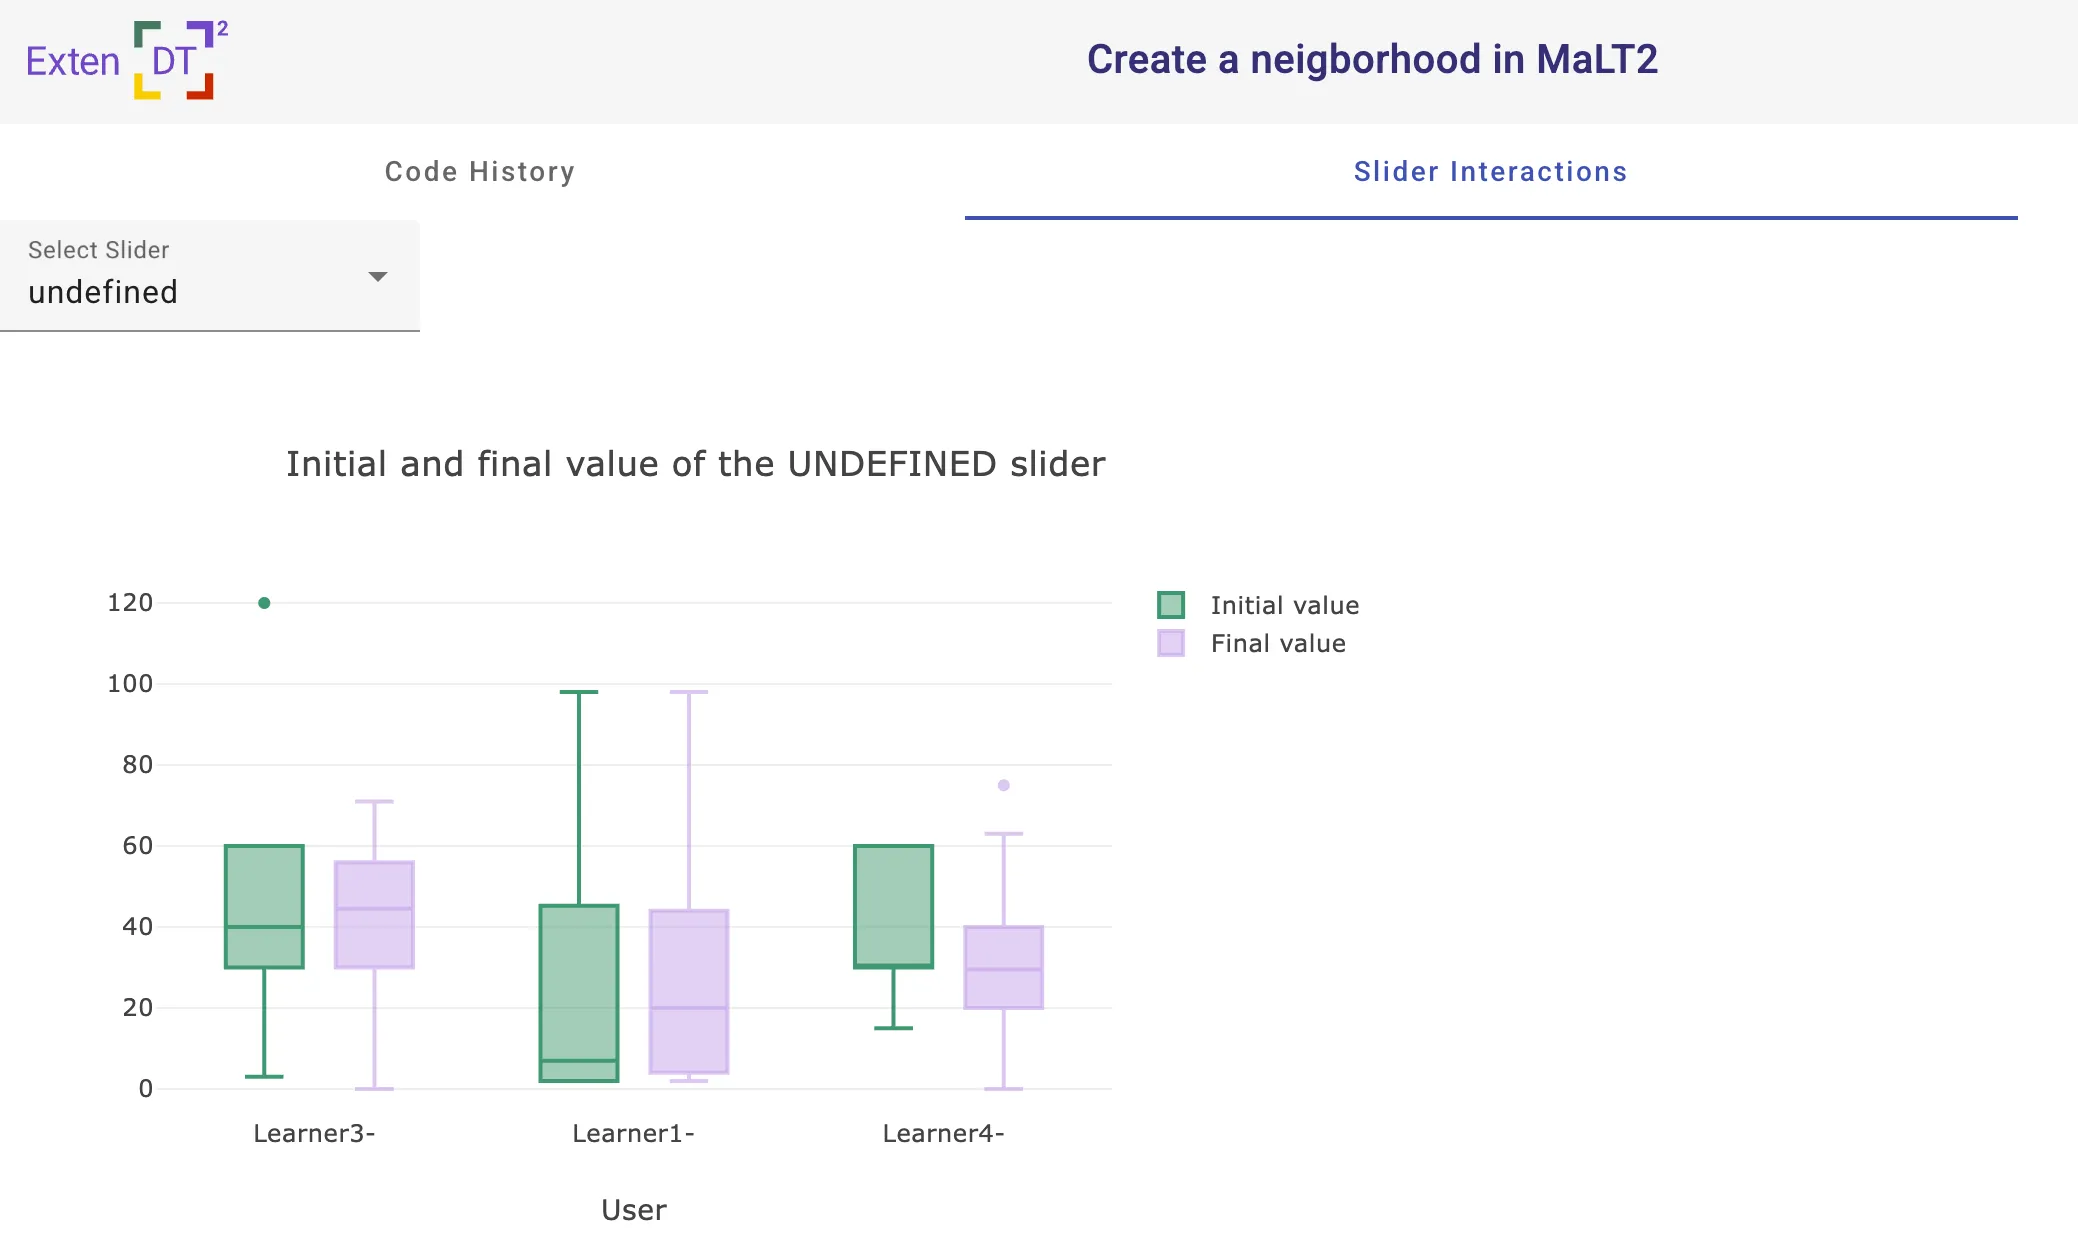
Slider Interactions
Slider Interactions shows a box plot with min,max and mean initial and final values for each slider.
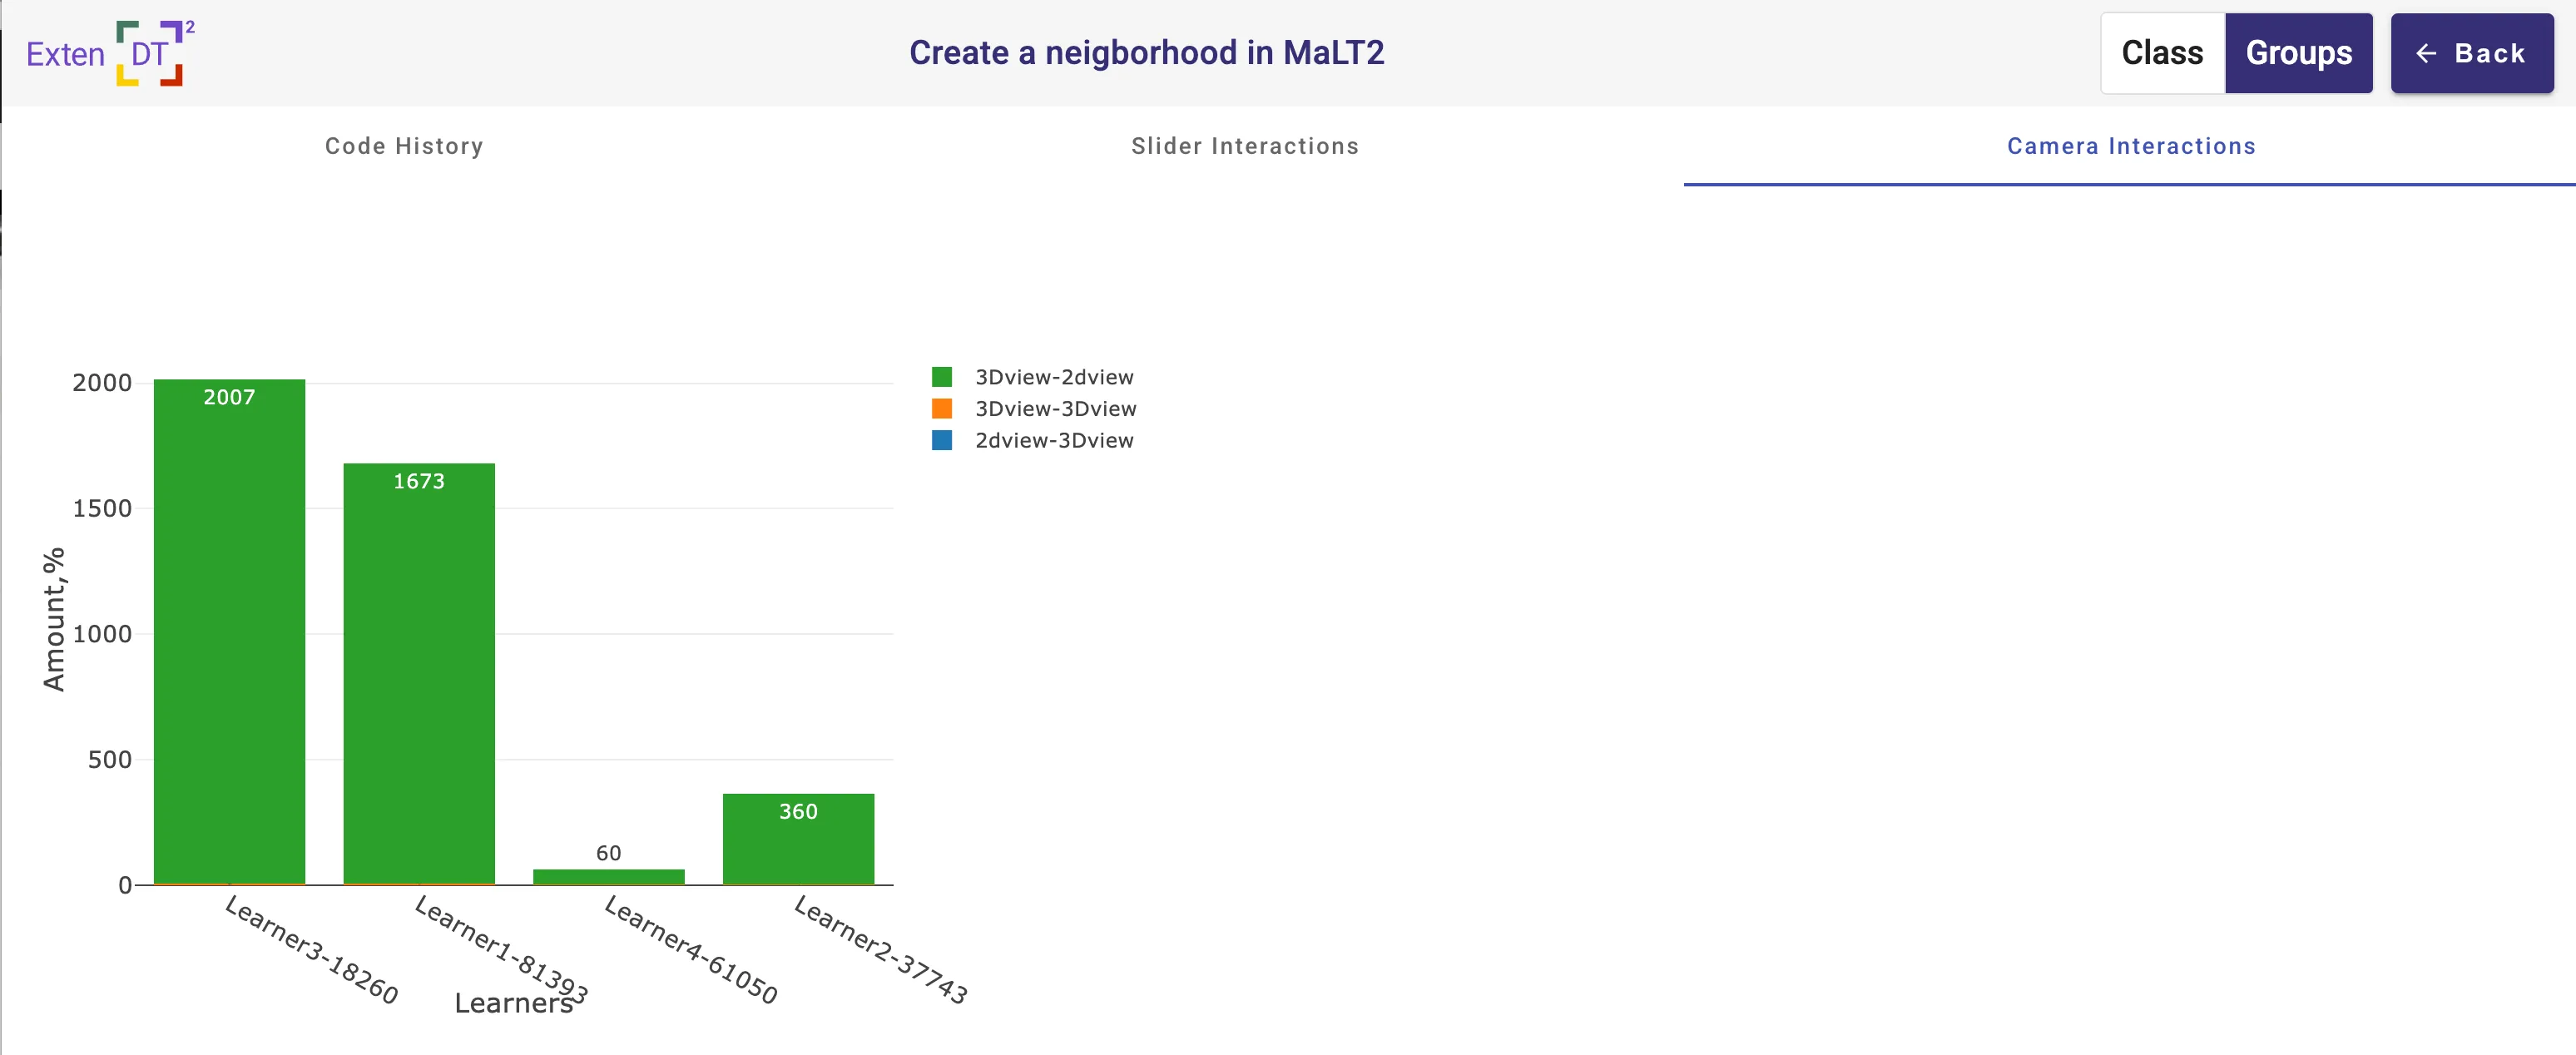
Camera Interactions
Camera Interactions shows the bar charts with number of switches between 2D and 3D camera view