Educators Dashboard
Main Page
The main page displays a table containing key details about all learning activities that were performed in the teachers’ classroom. It shows, for each activity, the activity name, the learning tool used, the number of participants (learners), the creation date, and the total time spent by all participants. It is also possible to search a specific learning activity by its name using the Search field.
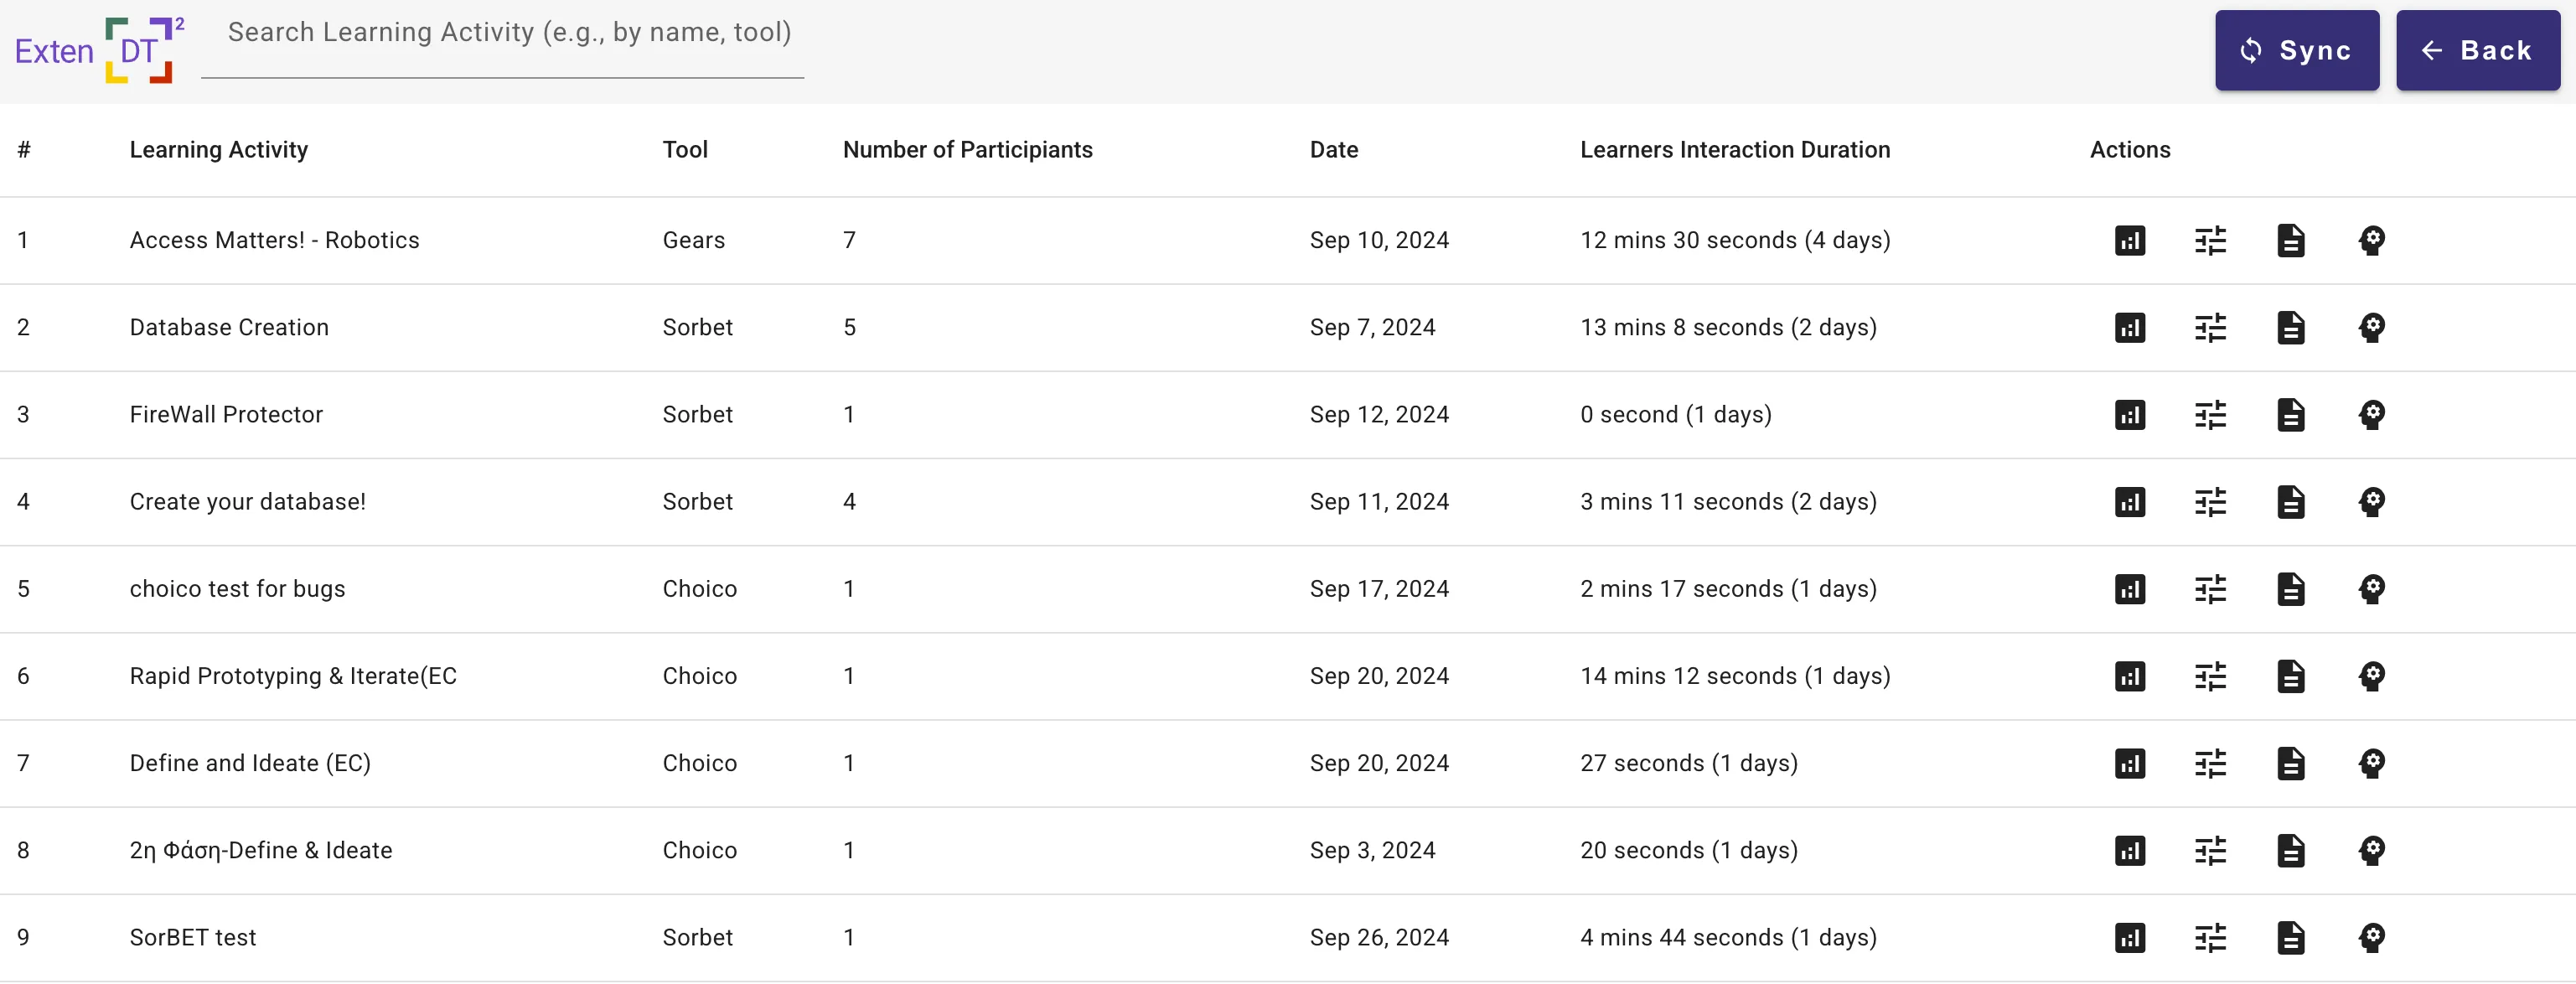
For each learning activity the teacher can access the:
- Predefined Dashboard
 which contains default interactive visualisation charts/graphs which shows some indicators of the learners’ performance, achivments, and interaction with the learning tools.
 - Configurable Dashboard
 which allows educators to authorize the measurment of the students’ motivation, experimentation, criativity, interaction with technology, and understanding concepts. Additionally, it allows to specify the assosiated 21st centiry skills for each concept (e.g., understading, motivation, experimentation, criativity, and interaction with technology) tailored a specific learning activity.
 - Raw LA data
 in order to download in a sutable format such as CSV/JSON for further advanced data analysis for a spesific study.
 - Settings of Design Thinking Phases
 in order to provide the start and ending date and time for each design thinking (DT) phase. This will allow to get the visualisations tailored a specific DT phase.
When you open the dashboard for the first time in a browser, it loads all learning activities associated with the your account up to the current date. However, if you cannot find a recent learning activity, you should use the “Sync” button, located at the upper right corner to fetch the latest learning analytics data.