Configurable Dashboard
The Configurable Dashboard is the authorable learning analytics dashboard for teachers to authorize the assessment of the learners’ motivation, experimentation, understanding, interaction with technology, and creativity using the LA data generated from the learning tools.
In order to access the configurable dashboard, you need to find it in the learning activities table presented in the main page and then click on the view the configurable dashboard button:

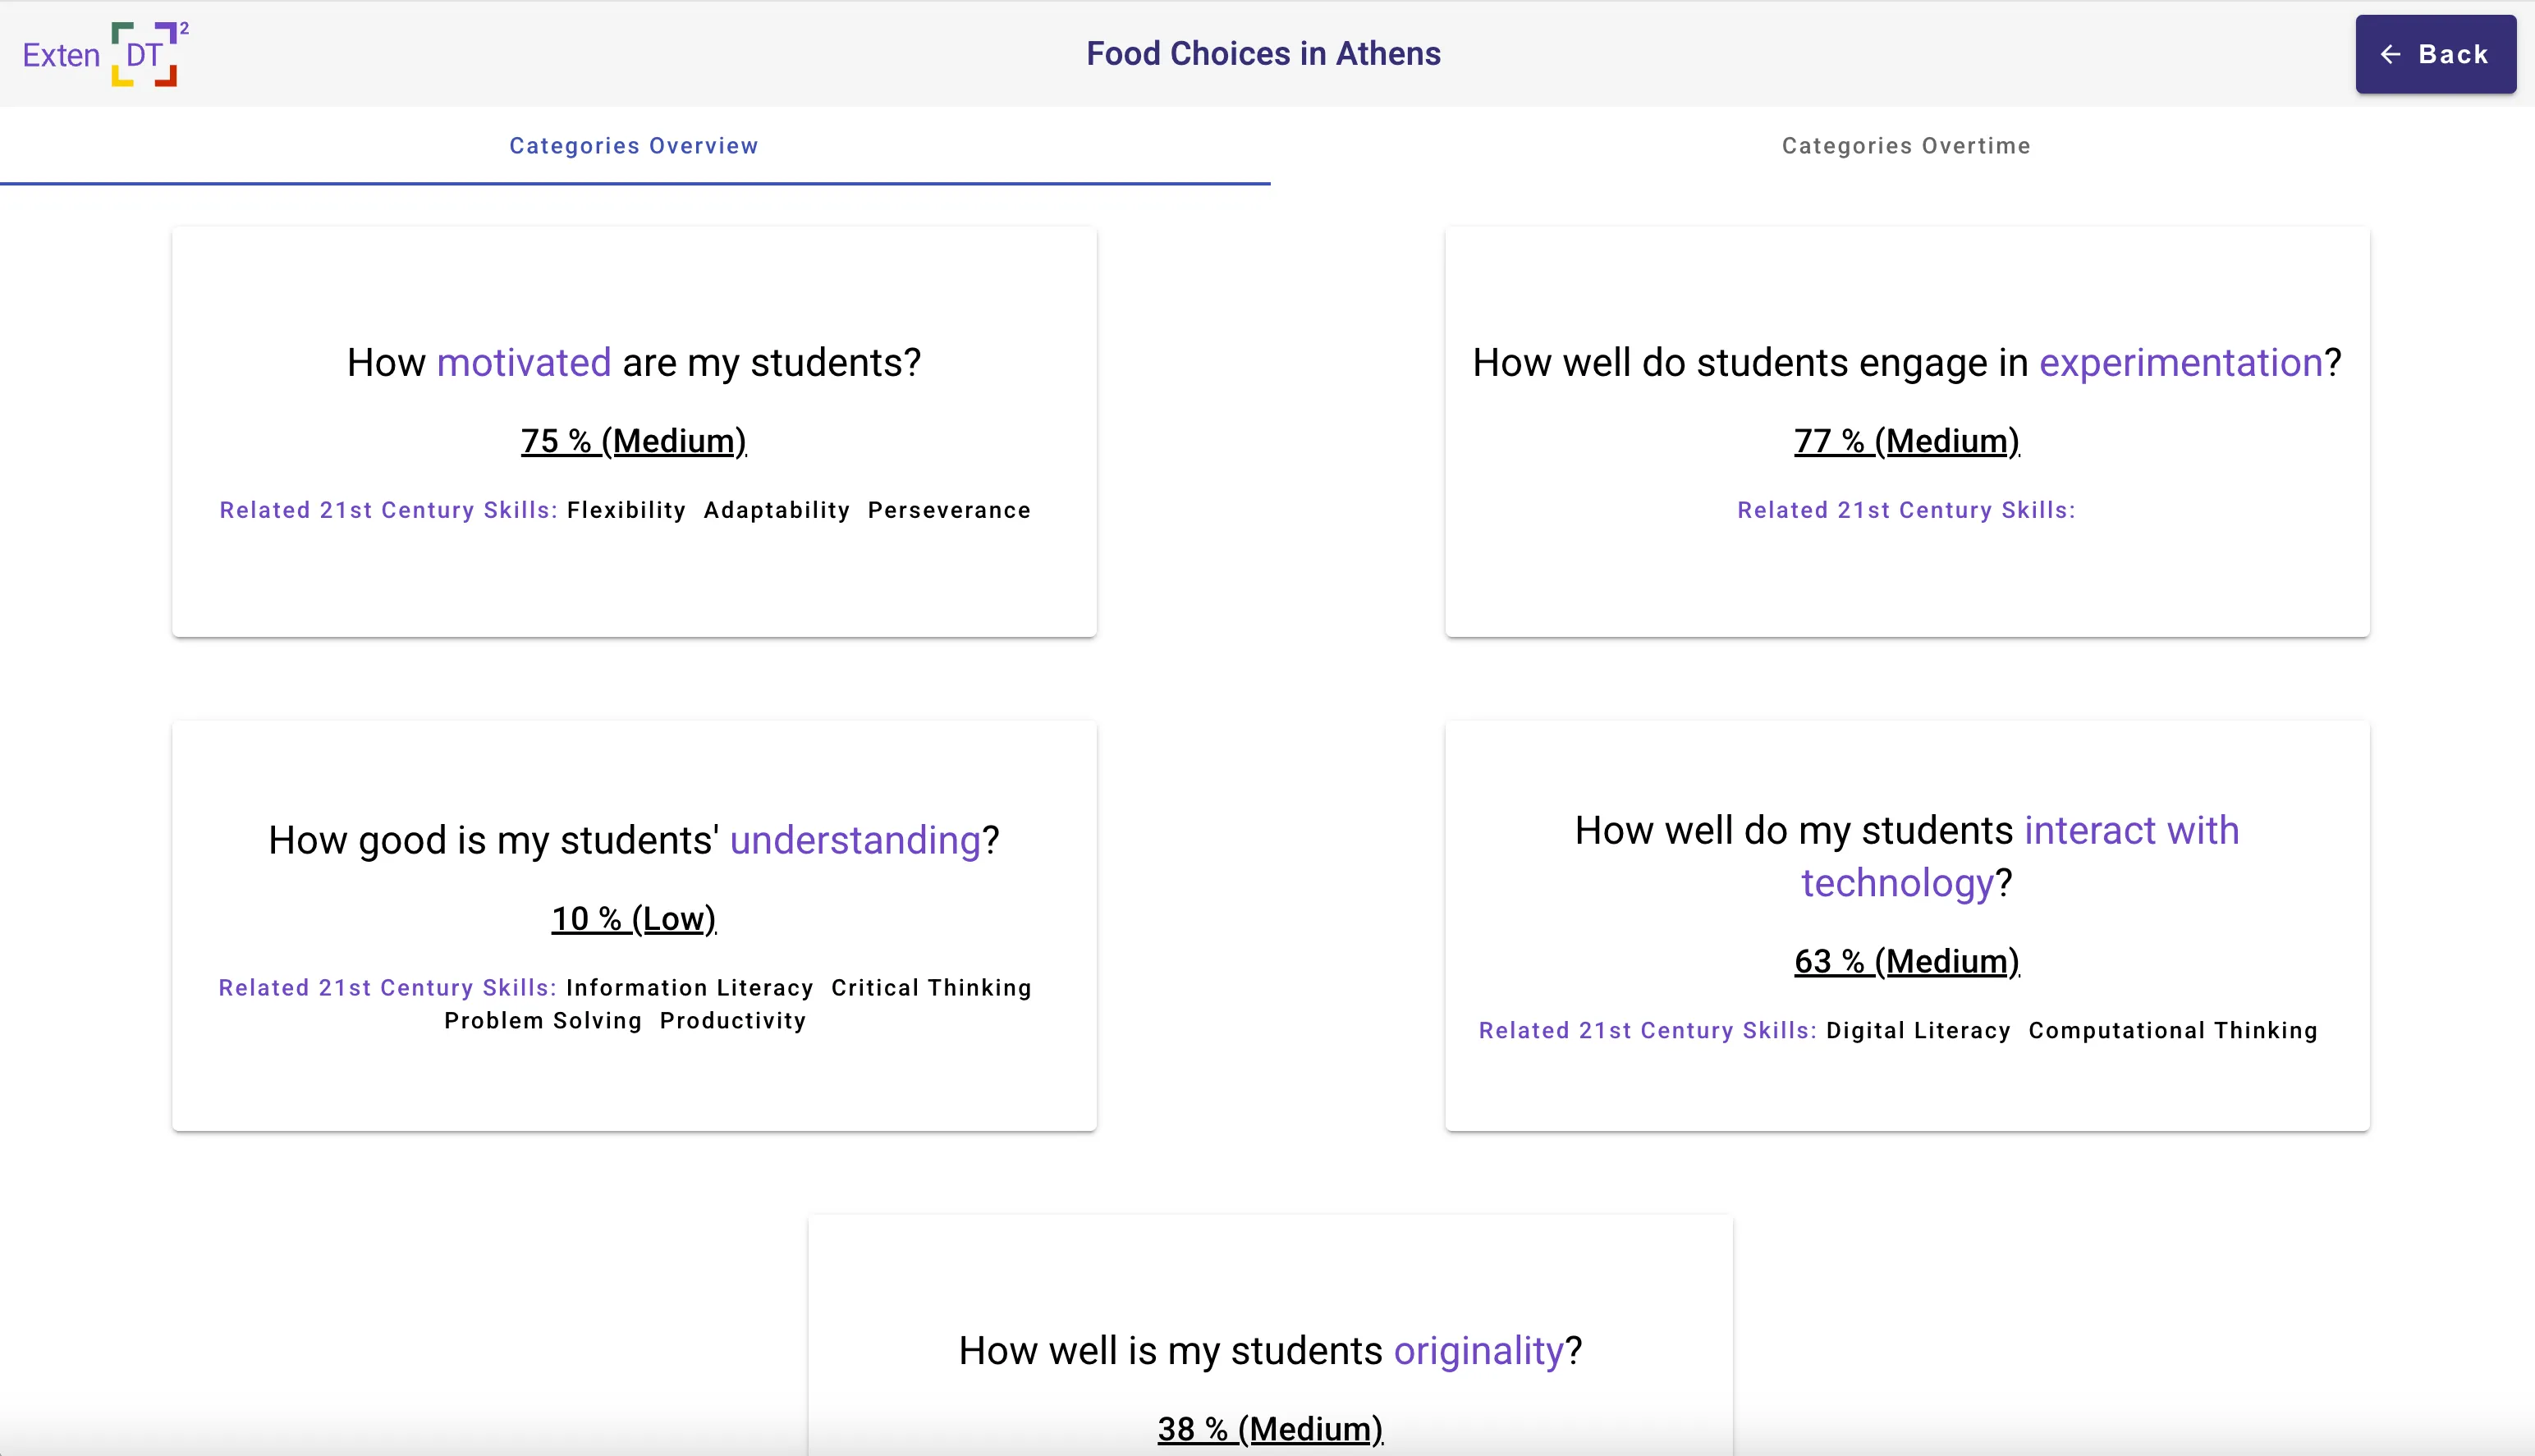
On this page, you will find two tabs, the Category Overview and the Categories Over Time.
Category Overview
The Category Overview tab allows you to gain insights into the following categories: students’ motivation, experimentation, understanding, originality, and their interaction with technology. For each category, you can also see the 21st-century skills associated with it. The performance of the entire class in every category is displayed by means of an overall score on a scale from 0 to 100, where 0-49 represents a low level, 50-70 indicates a medium level, and 71-100 reflects a high level of performance.
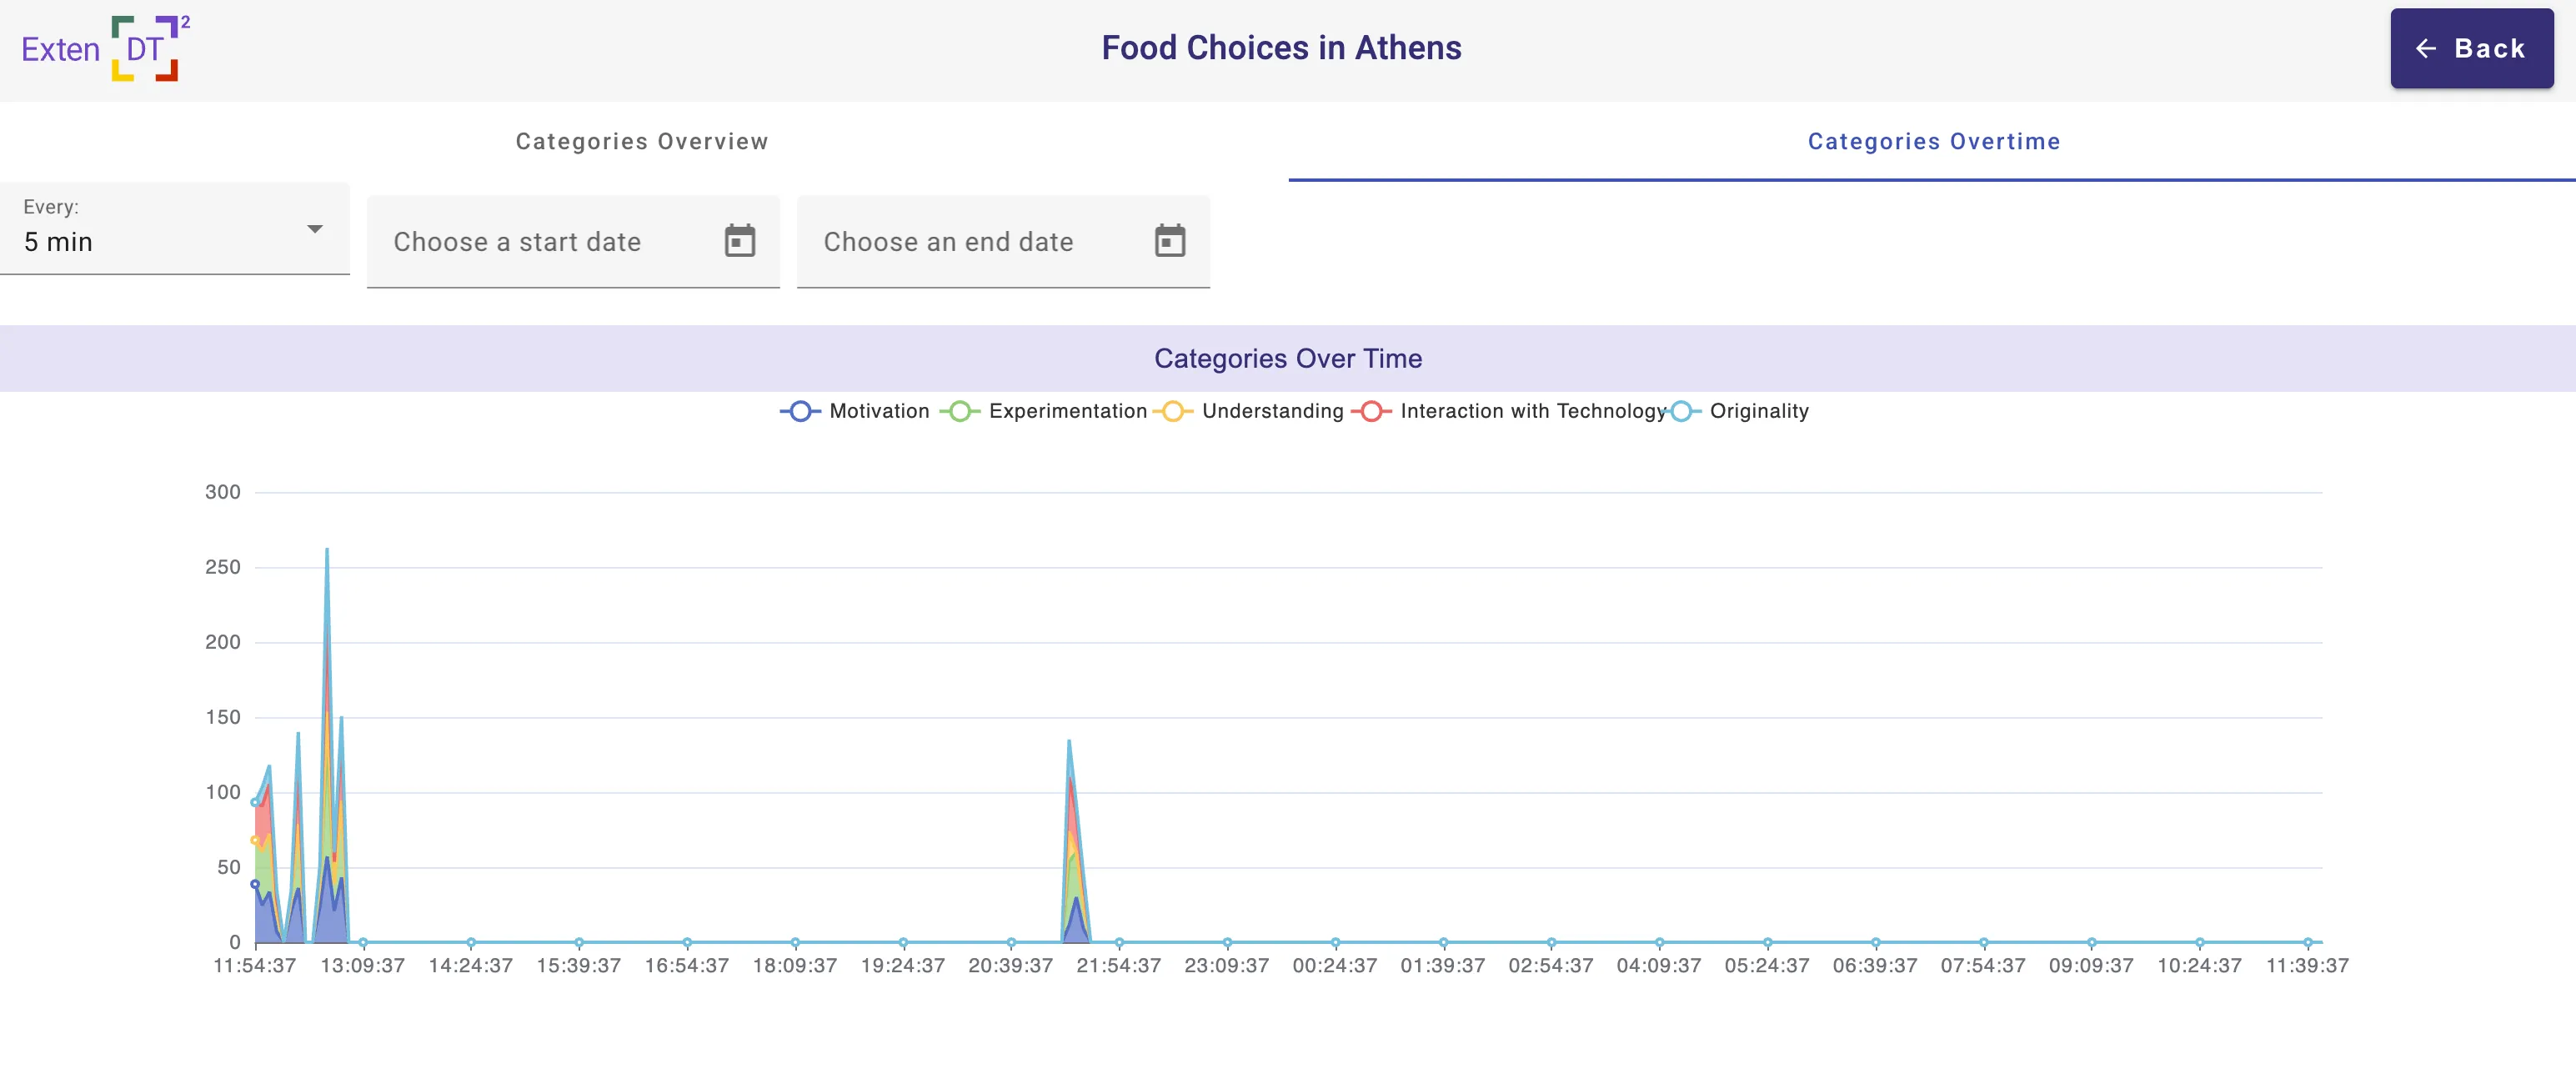
Category Over Time
The Categories Over Time tab tracks students’ motivation, experimentation, understanding, originality, and interaction with technology during the entire learning period, with data available at intervals of 5, 10, 15, or 20 minutes.Additionally, you can select specific dates and times corresponding to a particular design thinking phase to observe insights into students’ motivation, engagement, and other factors during that period.
Performance Assessment
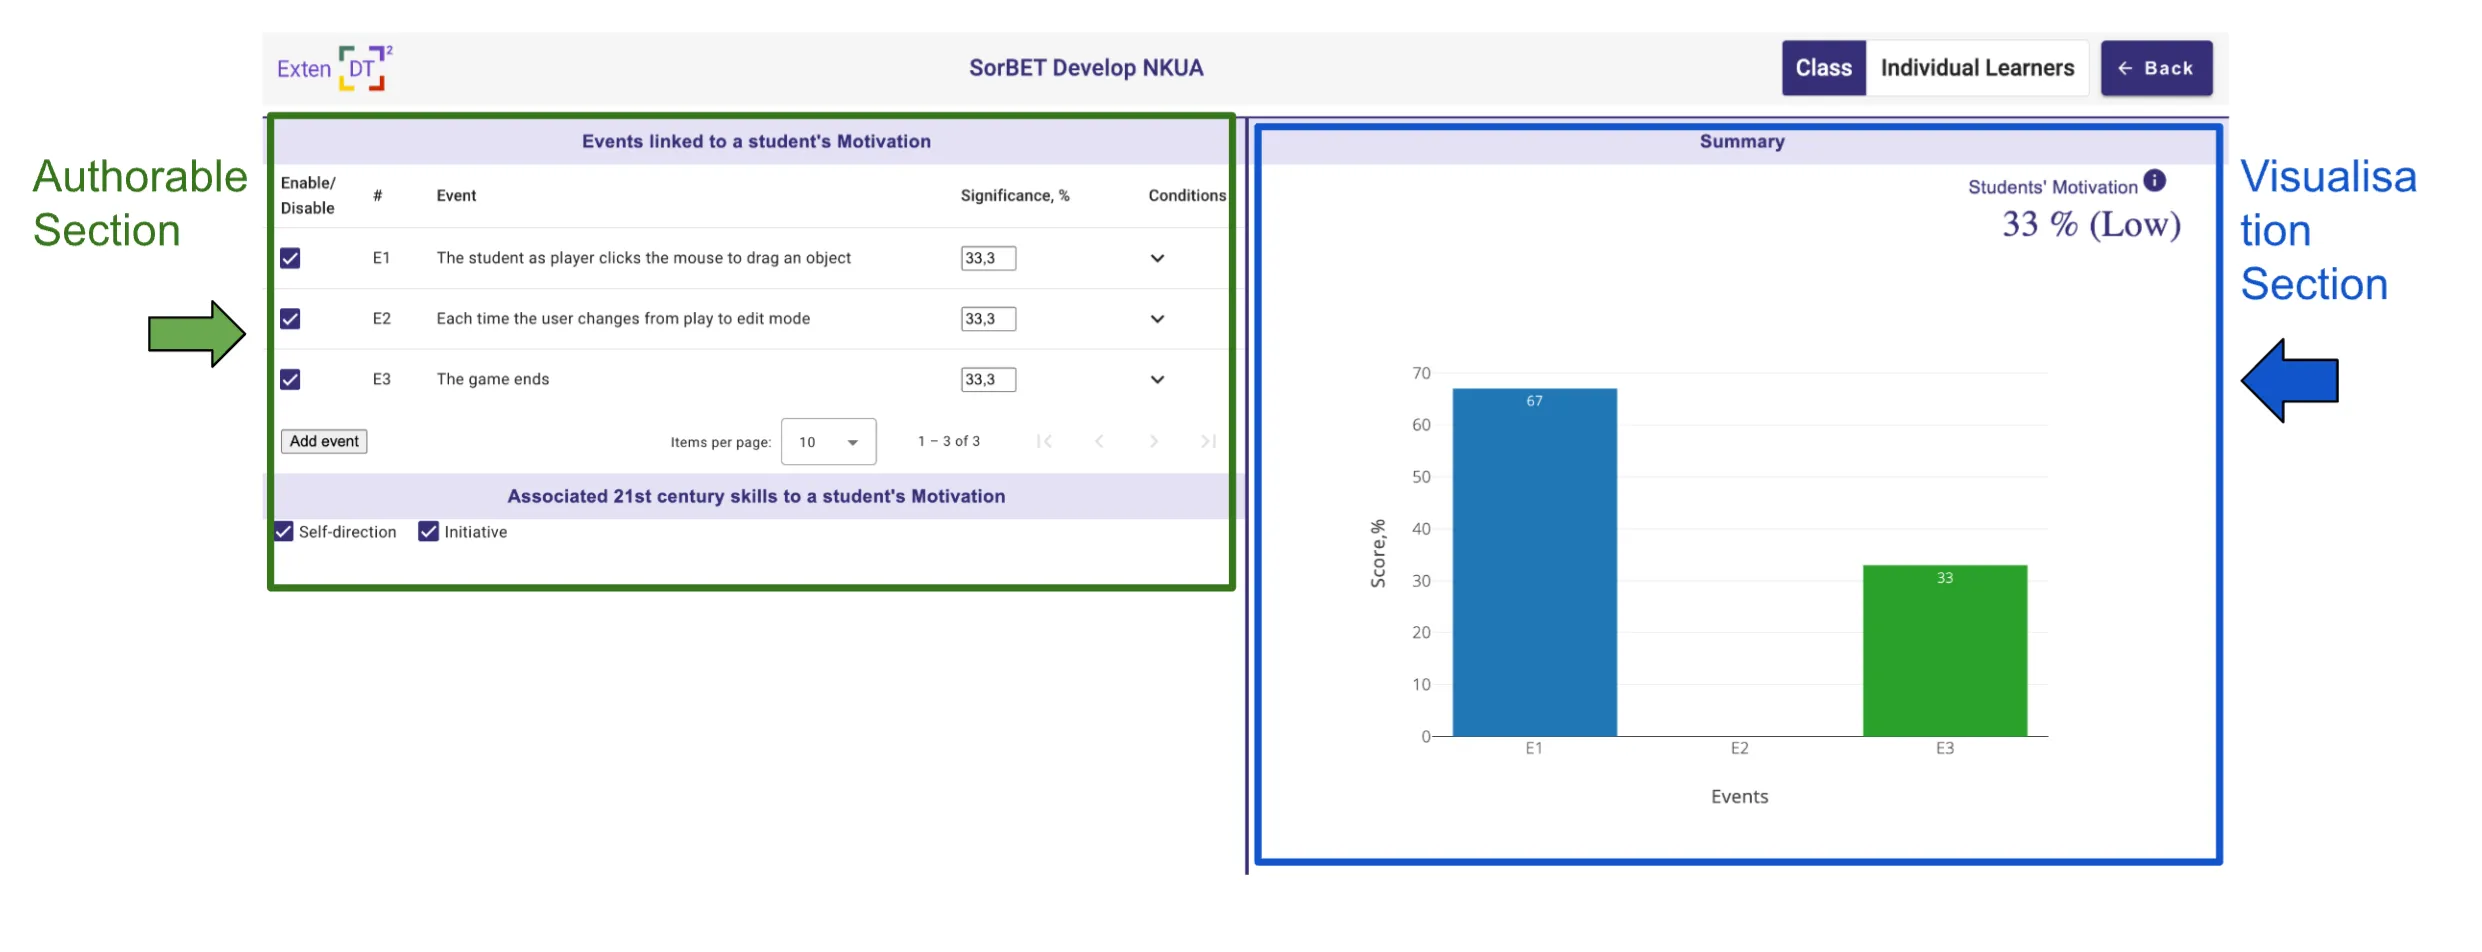
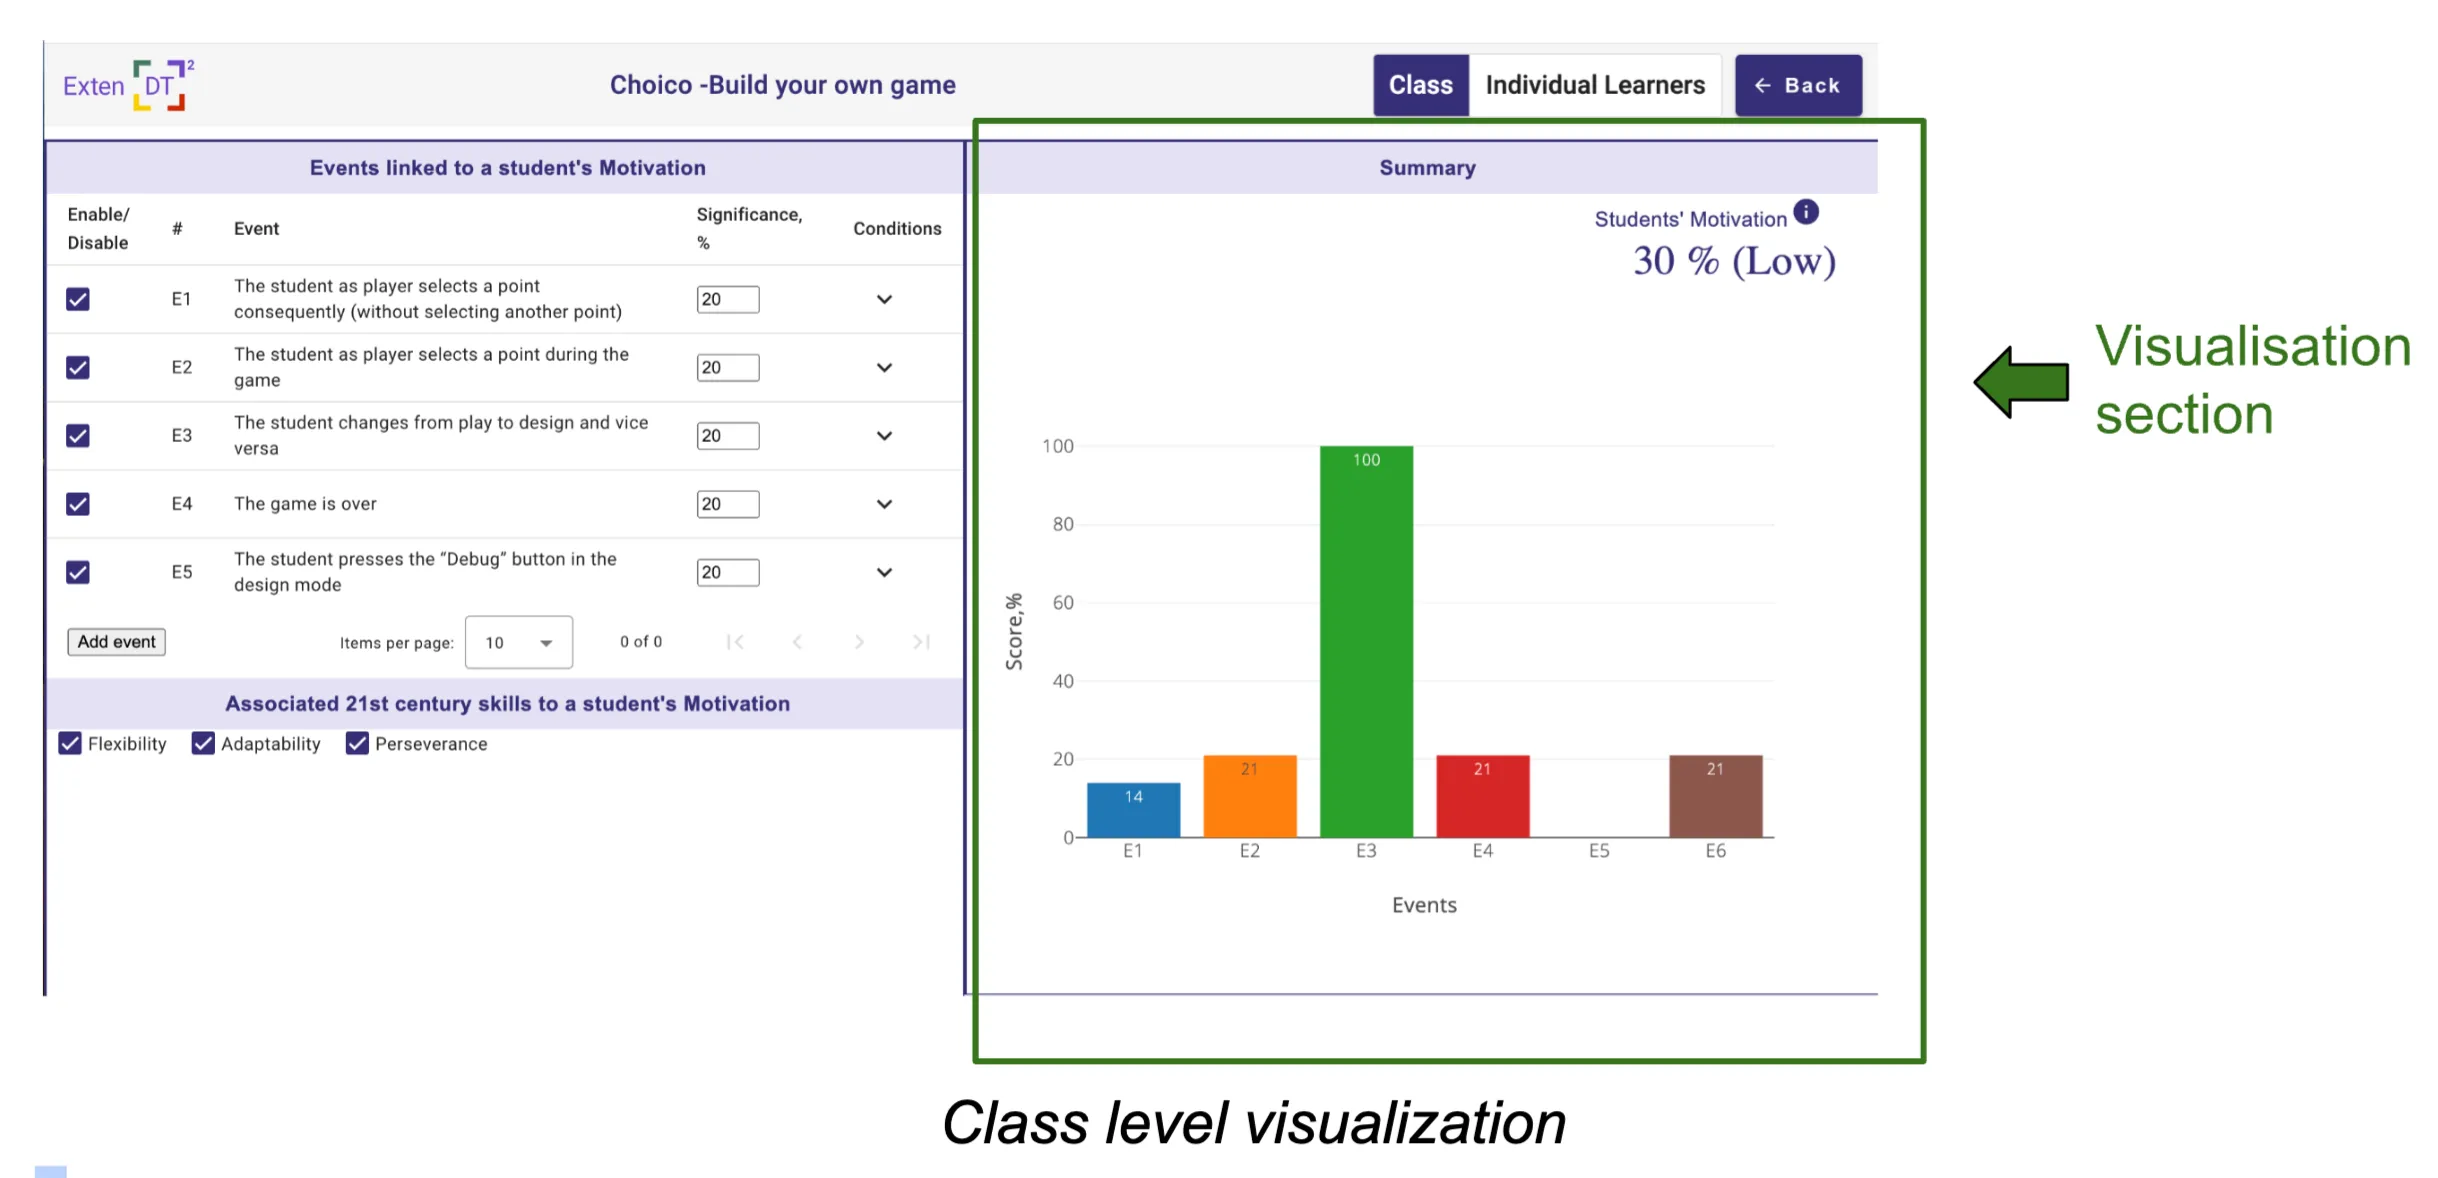
When you want to analyze the performance of the class or individual groups of learners, you have to go to the Category View page. You reach this page by going to the Category Overview and click on a category. The category page opens, which consists of two parts: configurable (authorable) left side, and right side is the performance visualization and assessment (overall score in %). Educators can authorize events and their associated 21st-century skills for a specific category (Authorable section). On the left side of the dashboard (as shown in Figure below), there is an authorable section where you see the events that are linked to students’ motivation. You can configure these events in a meaningful way for your their learning activities. The user interacts with the visualization section through the changes made in the event table within the authorable section. Any modifications in the authorable section (event table) are immediately reflected in the visualization section.
Authorable Section
In the Authorable Section, users are first required to review each event and determine which ones are relevant to include. To exclude irrelevant events, you can simply disable them using the “Enable/Disable” checkbox. The connection between events and categories is explained in detail in the Categories and Events section.
The event table in the authorable section is interactive, allowing users to configure each event individually. You can assign a “Significance” value (in %) to indicate how much each event contributes to its respective category. It allows educators to indicate how important or significant a particular event to the overall learning activity. The total significance across all events must add up to 100%. By default, all events are treated equally, meaning they contribute equally to the overall category score.
Users need to review each enabled event and configure the “Conditions” for when and how frequently the event occurred to evaluate good performance. This process is subjective and will vary for each learning activity. For instance, what constitutes good performance in one activity might not apply to another, depending on the learning objectives and the desired outcomes. The default value for the conditions is that the event only needs to occur at least once throughout the entire learning activity.
In the event conditions configuration expandable panel, there are two filters: by time and by range. You can filter events by selecting all events, the first event, or the last event generated during the learning activity. Additionally, you can specify when these events occurred by choosing options such as anytime, within the first 5 or 10 minutes, or within the last 5 or 10 minutes of the activity.
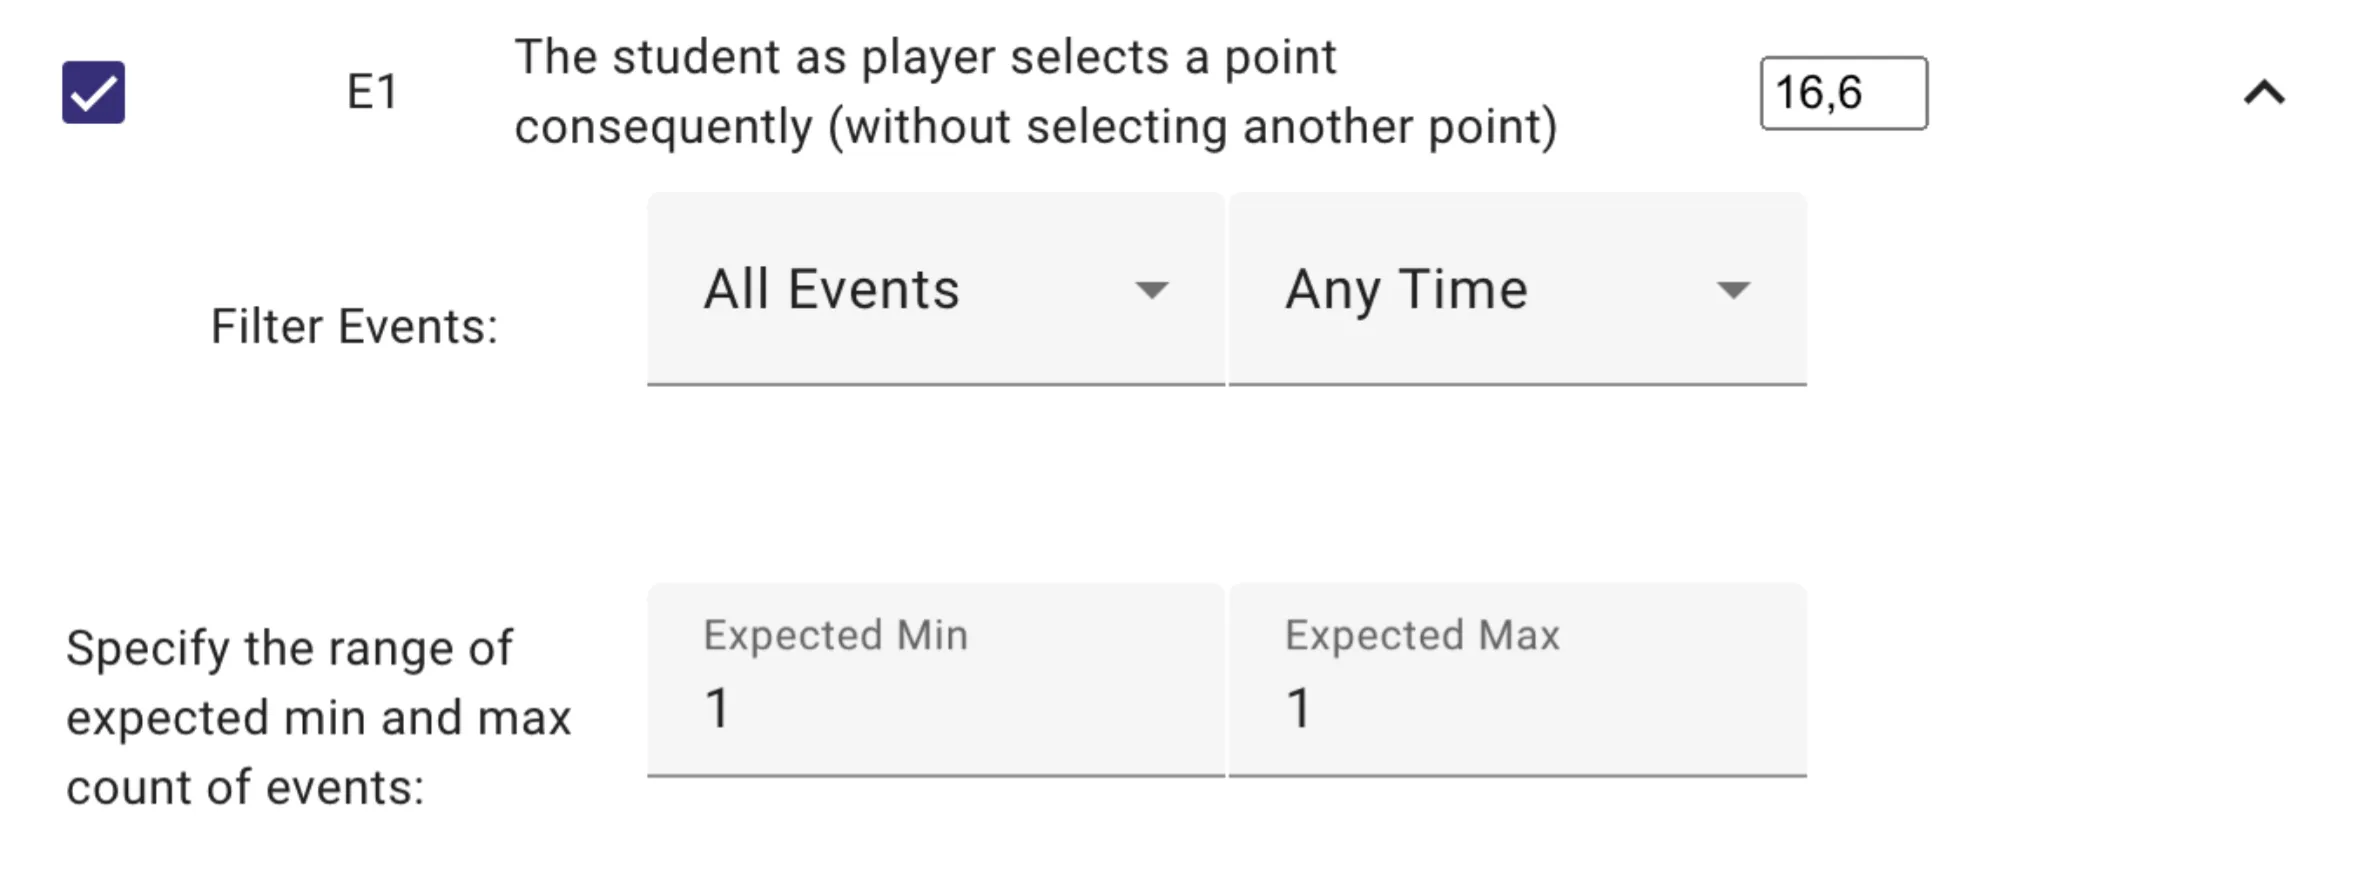
The range (min, max) represents the expected or desired value for counting an event as successful. If a learner’s generated events meet these conditions, the learner receives a category score equal to the event’s significance value, indicating that the student has achieved it. Currently, it is not possible to measure the “intensity” or differentiate between varying levels of achievement, as all learners are considered to have equally achieved the event when the conditions are met. In this way, the dashboard does not differentiate individual performance levels. However, it is possible to configure the events to identify which groups performed at different levels of activity( see row 5 in the Example table).
Examples on how to configure the events to assess student’s motivation/experimentation/etc.
Table 1. Examples of Event Authorizations
Table 1. Examples of Event Authorizations
| Example | Instructions on how to configure the event |
|---|---|
| As a teacher, I expect students to have an event X at the beginning of the learning activity (in the first 5 minutes). | Click the arrow button to expand the event’s configuration details. In the Filter Events section, all events will be used by default. To filter events that occurred only during the first 5 minutes of the learning activity, select the “First 5 minutes” option. |
| As a teacher, I expect students to have an event X happening between 10 and 20 times at the end of the learning activity. | Click the arrow button to expand the event’s configuration details. Specify the following filters and min/max conditions. |
| As a teacher, I am satisfied if the students have an event X at least one time at the beginning and at the end of the learning activity. | At the beginning of the learning activity: |
| At the end of the activity, you need to add a new event X using the button at the bottom of the table. In the event dialog, select the event. It will appear as a last row in the event table. Expand the configuration details and provide the following conditions: | |
| As a teacher, I expect the students with high performance to have an event X more than five times, and for students with less performance, I expect to have this event X less than five times. | Two events should be configured. For high performance: For low performance: |
Categories and Events
A series of requirements elicitation workshops were conducted with teachers from NKUA and NTNU to understand what types of information they consider important when students interact with exploratory learning tools, particularly regarding 21st-century skills. The outcome of these workshops led to the definition of five key concepts: motivation, experimentation, understanding, interaction with technologies, and originality. The concept was developed to group related 21st-century skills under a common category. Each category serves as an umbrella for specific skills that contribute to students’ development in these areas. These categories are designed based on 21st-century skills and the events generated by the learning tools.
Categories:
- Motivation represents skills related to the self-direction and initiative.
- Experimentation represents skills related to the flexibility, adaptability, and perseverance.
- Understanding represents skills related to the information literacy, critical thinking, problem solving, and productivity.
- Interaction with technology represents skills related to the digital literacy and computational thinking.
- Originality represents skills related to the creativity and innovative thinking.
Choico Events
| Category | Event | Explanation |
|---|---|---|
| Motivation | The student as player selects a point consequently (without selecting another point) | This type of event could show that the student is repeatedly trying the same action, possibly due to a lack of clarity or understanding, which could be an indicator of low motivation or disengagement. |
| The student as player selects a point during the game | This event demonstrates active participation and decision-making within the game, showing focus and interest in progressing or achieving a specific goal. | |
| The student changes from play to design and vice versa | Switching between play and design modes suggests curiosity and a desire to experiment or improve their work. | |
| The game is over | This event shows how many times they played the game, which is an indirect measure of motivation when they decide to try again or not. | |
| The student presses the “Debug” button in the design mode | Debugging reflects intrinsic motivation and persistence to identify and fix issues, showcasing the student’s determination and willingness to improve their work. | |
| Experimentation | The student as player selects a point during the game | This action shows active exploration of different options or paths, reflecting experimentation. |
| The student changes from play to design and vice versa | Indicates a mindset of experimentation as the student switches between modifying and testing elements. | |
| The student presses the “Debug” button in the design mode | Debugging is a critical part of testing and refining ideas, central to experimentation. | |
| The student as designer changes the field value (cell) of a certain point in the database | Shows exploration and testing of how altering data impacts the overall game design. | |
| The student as designer modifies a point (renames it/changes its position/deletes it) | Reflects iterative experimentation with game behavior and dynamics. | |
| The student as designer adds a new field (column) in the database | Explores new options for data representation, testing its impact on the game. | |
| Understanding | The student as designer adds a new field (column) in the database | Demonstrates understanding of how data fields relate to the game’s functionality. |
| The student as designer makes a particular number of changes to gameplay rules code in Blockly | Reflects comprehension of how rules influence game behavior and the ability to manipulate them effectively. | |
| The student as designer makes changes to database fields | Making multiple changes indicates a comprehensive understanding of data points and options. | |
| The student as designer makes changes to ending rules code in Blockly | Reflects understanding of the logic and conditions behind the game’s conclusion. | |
| The student as designer makes changes to initial settings code in Blockly | Demonstrates knowledge of how initial conditions influence the game experience. | |
| Interaction with Technology | The student as player selects a point during the game | Reflects engagement with the digital environment and navigation within the game. |
| The student changes from play to design and vice versa | Shows engagement with designing the game. | |
| The student as designer changes the field value (cell) of a certain point in the database | Reflects engagement with designing the game. | |
| The student as designer modifies a point (renames it/changes its position/deletes it) | Reflects engagement with designing the game. | |
| The student as designer adds a new field (column) in the database | Reflects engagement with designing the game. | |
| The student as designer changes the background image of a map layer | Shows ability to customize the game’s visual representation. | |
| The student as designer adds a new point on the map interface | Demonstrates skill in manipulating and enhancing the map interface. | |
| Originality | The student as designer modifies a point (renames it/changes its position/deletes it) | Demonstrates creative thinking by altering elements to reflect their own ideas and vision. |
| The student as designer adds a new field (column) in the database | Enhances game variability by thinking outside the box, reflecting originality. | |
| The student as designer changes the background image of a map layer | Reflects personal style and creativity in customizing the game’s visual elements. | |
| The student as designer adds a new point on the map interface | Shows creative thinking by expanding the game with new possibilities and dynamics. |
Visualization Section
On the right side of the dashboard (as shown in the Figure below), a bar chart visualization reflects the interactions configured in the authorable section (event table). By default, it displays achievements at the class level. Each event is represented as a bar, with a maximum value of 100%, indicating that all learners achieved the configured conditions for that event. In the upper right corner of the bar chart, the student’s overall score is displayed as a percentage (0-100%). When all enabled events are achieved, the overall score is 100%, which is the average of the scores for each event.
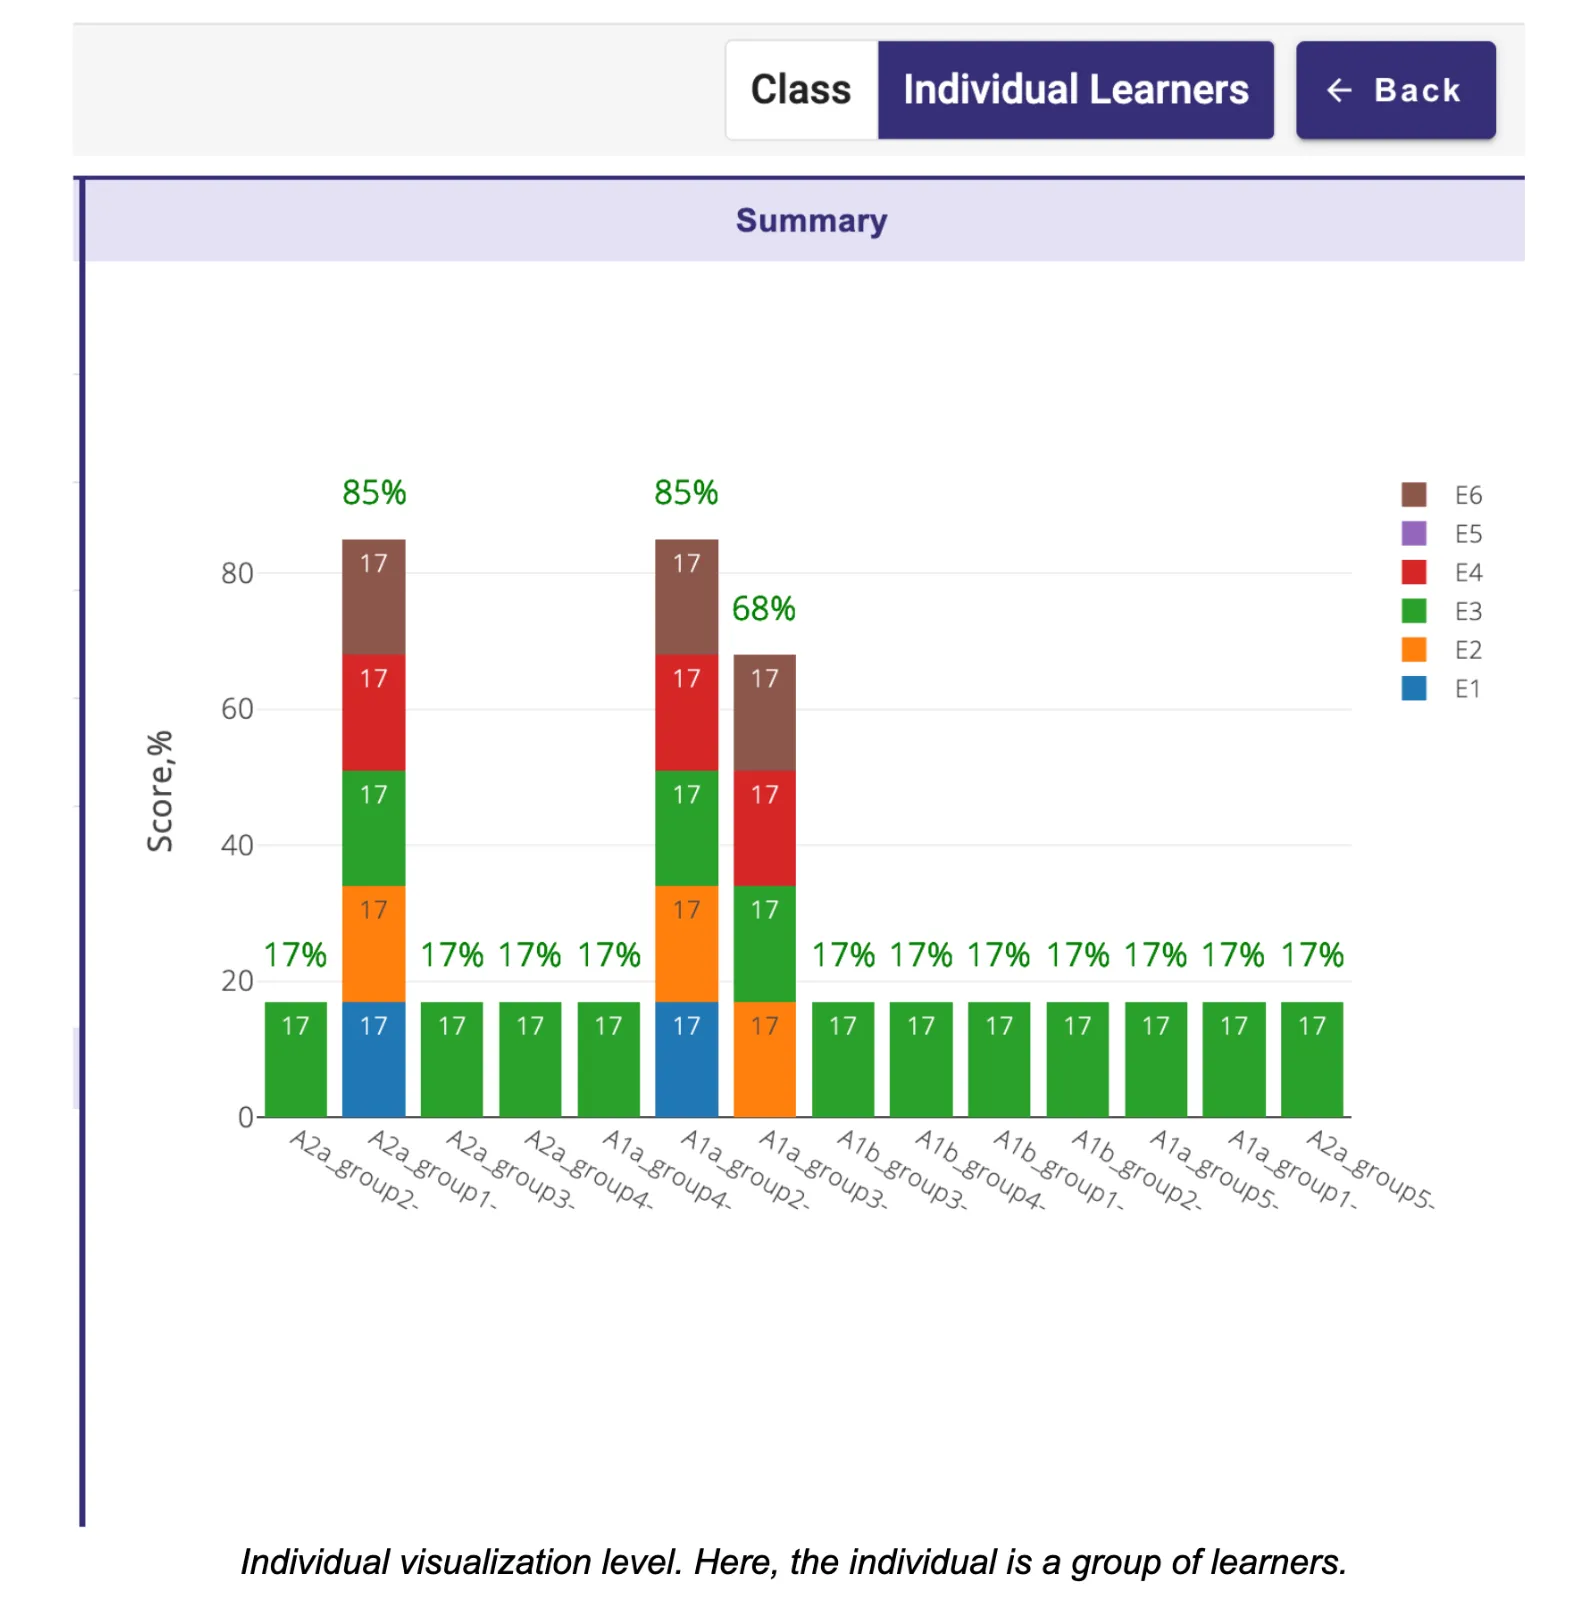
If you switch to Individual groups level a stacked bar chart will be shown, where each bar represents an event. The number inside the bar reflects the “Significance” value, which is the maximum score when the event’s conditions are satisfied. If an event does not meet its conditions, its value is 0% and is not displayed on the graph.
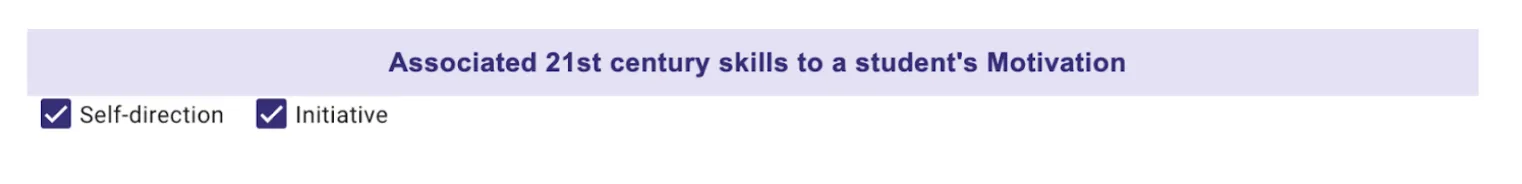
Configuring the 21st Century Skills
The authorable section of the dashboard enables educators to associate 21st-century skills within the category by toggling each skill on or off (as shown in Fig below). The decision is left to the teacher and should be based on the nature of the learning activity.